SMART Analyses
SMART analyses are designed to:
• Present repository data to support decision-making
• Formulate recommendations for a decision in a given field
• Preparing for action after the decision
Hopex IT Portfolio Management offers two SMART analyses to evaluate the applications in a portfolio:
• TIME Analysis
• Cloud Migration Analysis
How the SMART analyses work
TIME Analysis and Cloud Migration Analysis are performed on a portfolio of applications. They present, for each application in the portfolio, the values of aggregated indicators, as well as the decision recommendation, when available.
Aggregate indicators are calculated from basic indicators that have a default weight in the calculation.
The value of the aggregated indicators is accompanied by a data completeness percentage that evaluates the relevance of the analysis.
In the analysis report, commands allow you to:
• recalculate the values of the aggregated indicators
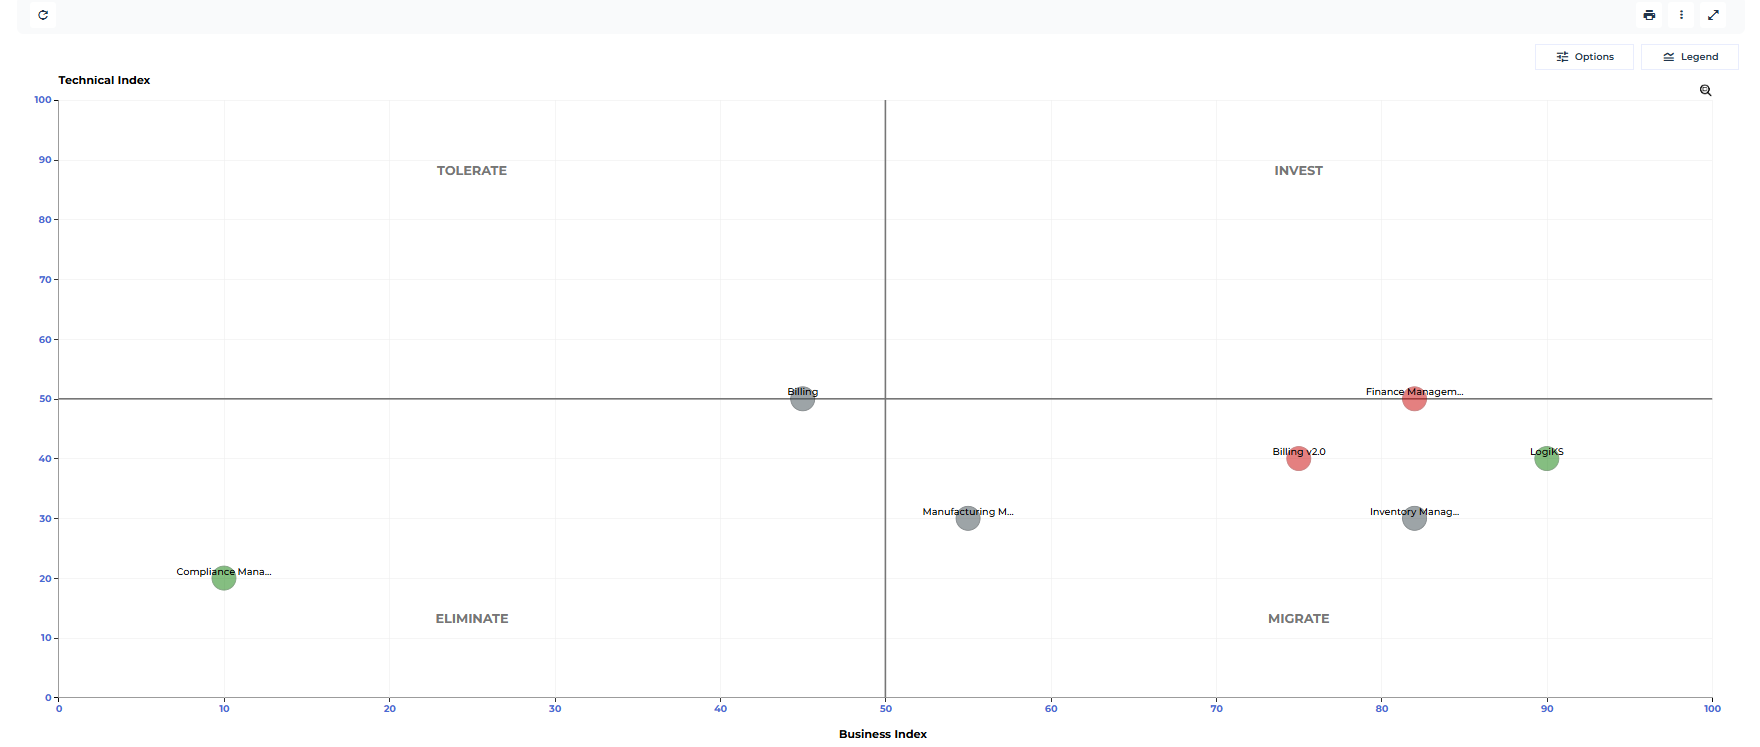
• graphically view the values of the aggregated indicators
• see the data completeness details: a matrix indicates which basic indicators have been filled in for each application
• finalize analysis
TIME Analysis
This analysis based on the Gartner model (Tolerate, Invest, Migrate and Eliminate) provides rationalization recommendations on the applications of a given portfolio as well as a graphical presentation of the analyzed applications.
Example
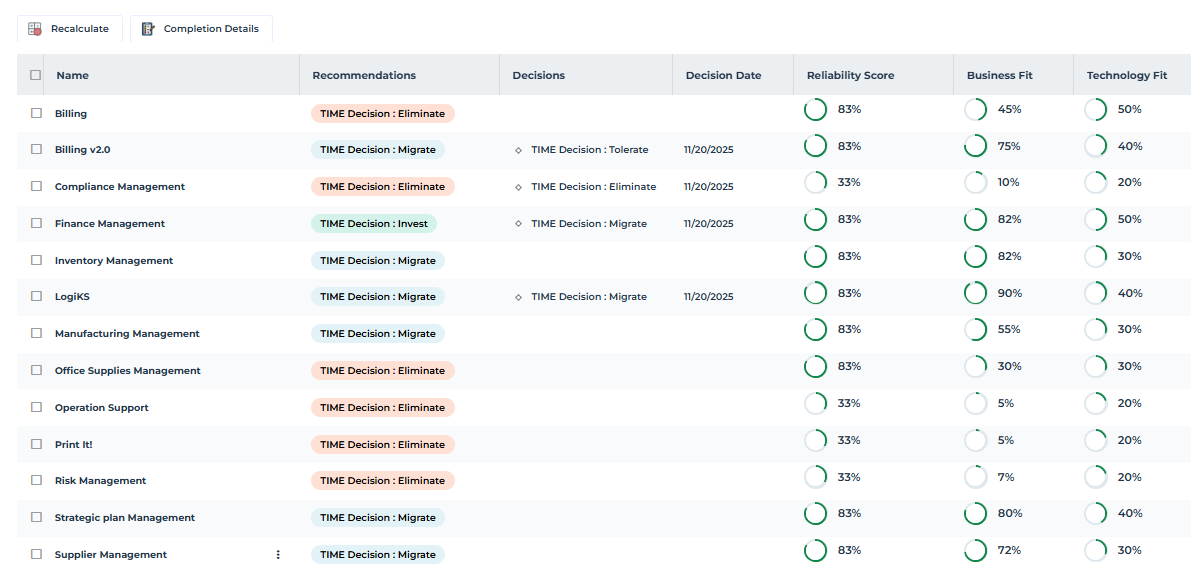
Indicators and their weight in the analysis
The recommendations displayed in the analysis are calculated on the basis of the following aggregated technical and business indicators.
Aggregated indicators | Basic indicators | Default weight |
|---|---|---|
Business indicator | Business value Functional support Service-level agreement (SLA) | 60% 30% 10% |
Technical indicator | Technical efficiency Technology obsolescence Application life cycle | 40% 40% 20% |
Sources of basic indicators
The analysis is based on the following basic indicators:
• Business Value, Functional Support and Technical efficiency from the latest application evaluation.
• The Service Level Agreement (SLA) defined in the Service Level Agreement section of the application properties.
• The Obsolescence risk: this corresponds to the highest risk of the technologies linked to the application.
• The Life cycle; the analysis looks for the application's production end date and calculates the difference with the current day.
Decision options
The possible decisions are as follows:
• "Tolerate": applications that create sufficient business value and whose costs are manageable, maintained for various reasons.
• "Invest": applications that are most lucrative and interesting in terms of investment.
• “Migrate”: applications that need to be modernized.
• "Eliminate": applications that have low business value or high risk. They must be eliminated.
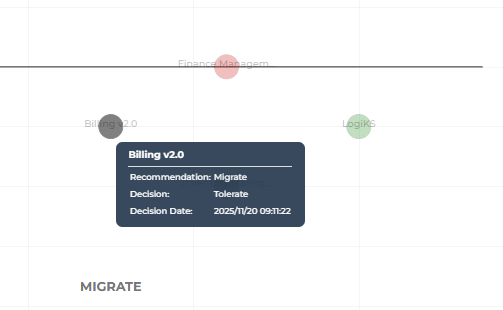
Once the decision has been taken, it is recorded on the application and displayed in the application properties.
You can also define decisions directly in the properties of the application of interest. See Entering a Decision on an Application.
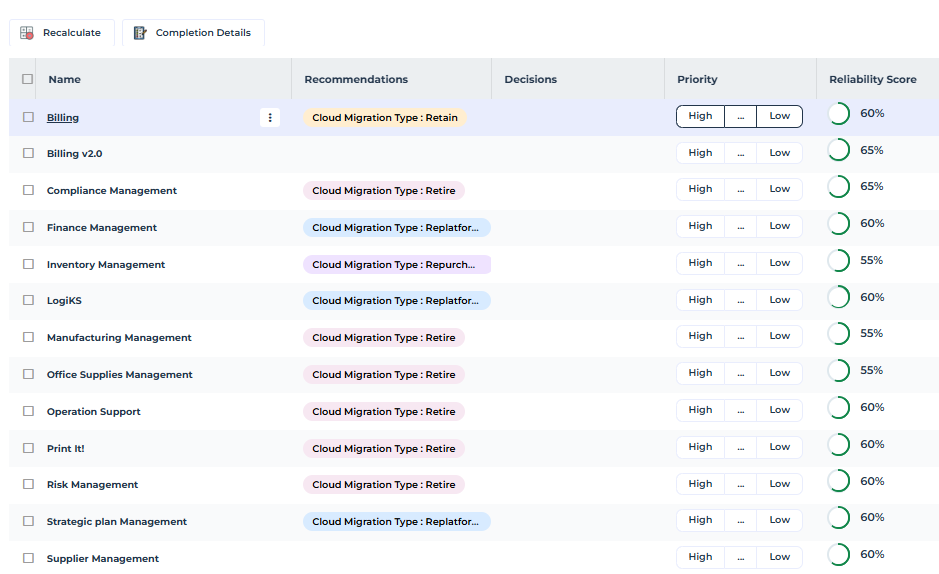
Cloud Migration Analysis
Cloud migration analysis presents migration recommendations for applications in a given portfolio.
Example
Indicators and their weight in the analysis
The recommendations displayed in the analysis are based on the following indicators.
Aggregated indicators | Basic indicators | Source | Default weight |
|---|---|---|---|
Migration Appetite | Last “Time” decision | Repository | 30% |
Latest application criticality assessment | Repository | 15% | |
Motivation: number of motivations | Questionnaire | 25% | |
Life cycle (the end of production is approaching) | Repository | 15% | |
Auto scale | Questionnaire | 15% | |
Migration Easiness | Number of different application flows | Repository | 25% |
Number of partner applications | Repository | 25% | |
Data regulations | Repository | 25% | |
Shared databases | Repository | 25% | |
Migration Readiness | CAST Cloud Ready Score | Repository | 20% |
Migration effort | Questionnaire | 20% | |
Application COTS (Customization weight) | Questionnaire | 20% | |
Saas Version of the COTS application | Questionnaire | 20% | |
Technical skills of the migration team | Questionnaire | 20% | |
Migration Safeness | Response time requirement | Repository | 20% |
Big data transfer required | Repository | 20% | |
Data Breach Risk | Questionnaire | 20% | |
Service disruption risk | Questionnaire | 20% | |
Risk of out-of-control budget | Questionnaire | 20% |
Sources of basic indicators
The analysis calculates a score between 0 and 4 for each basic criterion. The value of the indicator is then aggregated with a weight assigned to it. The aggregate score is normalized to 100.
The value of the basic indicators is based on:
• The TIME matrix values:
• "Tolerate": means that the application has a good technical score but less at business level. It is kept pending a decision. Migration score: 2.
• “Invest”: high business and technical value. The application is already good as it is. Score: 3.
• "Mitigate": applies to applications that we want to keep but restructure. The migration score is high: 4.
• "Eliminate": applications to be excluded. Value: 0.
• The last criticality evaluation of the application (business, functional, technology).
• The migration motivations from the migration assessment questionnaire: the more options are checked, the higher the score. If 4 or more options are checked, the score is 4.
• Application life cycle: the more distant the end date, the more interesting it is to migrate to the Cloud. The value of the indicator takes into account the number of months between the start date and the end date of production:
• between 0 and 6 months = 0
• between 7 and 12 months = 1
• between 13 and 30 months = 2
• more than 49 months = 4
• The number of application flows sent or received by the application: as the number of flows increases, the migration score decreases (as a large number of flows increases security risks, bandwidth problems, etc.).
• The number of distinct partner applications for flows sent or received by the application: the more partner applications there are, the lower the score.
• The number of regulatory frameworks associated with the data categories managed by the application: the more regulations there are, the lower the score.
• The number of deployed databases used by application software installations that are also used by software installations of other applications. The more databases, the lower the score.
• CAST Cloud Ready Score: this is CAST Highlight's analysis of an application's source code. The higher the parameter value, the higher the migration score.
• Application flows with “Required latency " qualification: the higher the latency value, the higher the score.
• Application flows with the “Communication weight" qualification. As the weight of communication increases, the score decreases.
Recommendations and decisions
By default, the recommendations are calculated from the ranges of the Business Value and Technical Efficiency indicators. The other indicators are not included in the recommendation.
Recommendations of the analysis are:
• Rehosting/Re-platforming
• Refactoring/Repurchasing
• Retire
• Retain
On these recommendations, possible decisions are:
• Replatform
• Repurchase
• Retain
• Refactor
• Rehost
• Retire
Once the decision has been taken, it is recorded on the application and displayed in the application properties.
You can also define decisions directly in the properties of the application of interest. See Entering a Decision on an Application.
Running a Smart analysis
To run the analysis:
1. In the navigation bar, click Applications.
2. In the edit area, click SMART Analyses.
3. Select the analysis type.
4. Select the portfolio to be analyzed.
5. Run analysis.
Recommendations are colored to highlight the decisions to be made. Vous pouvez cliquer sur le bouton Détails de complétude pour visualiser le détail des indicateurs sur lesquels se fondent les recommandations.
6. For each application, you can select a decision from the associated drop-down list.
The decision is recorded on the application. You can edit it on the same day. If you edit the decision another day, another decision is created and recorded on the application. It adds up to the history of decisions taken on the application.
The history of decisions can be accessed in the Governance page of the application properties.
 button, then select Governance.