Business Capabilities Reports
Some reports enable you to analyze the business capabilities of your repository according to different perspectives.
 For detailed information on reports, see Generating Reports.
Business Capability Breakdown Report
You can use a breakdown report to view:
• the objects that make up a business capability map
• the realization of capabilities by EA equipment
For more details on the use of a breakdown report, see Handling a Breakdown Report.Access
Example
Business Capability Coverage over Time
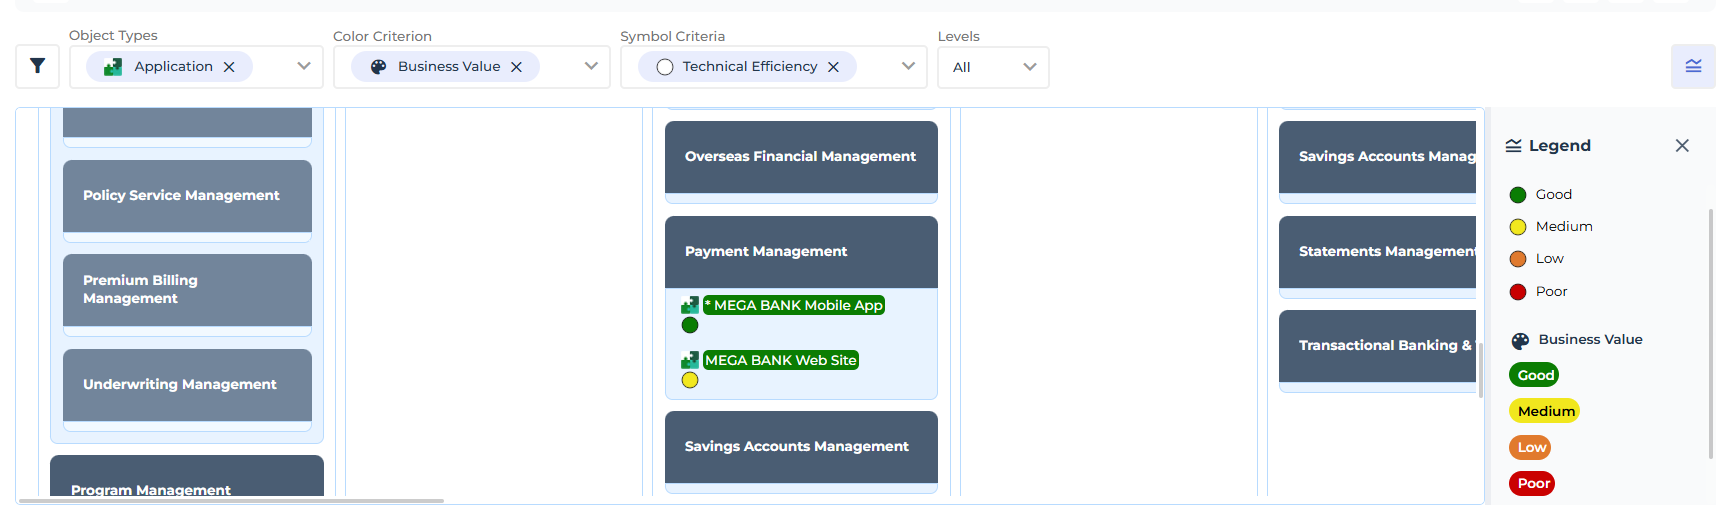
This breakdown report provides a temporal representation of the elements that make up a business capability map and the applications or application systems that cover them.
Applications are analyzed according to various possible criteria. A timeline shows their evolution over several years.
Two different report views are available:
• Capabilities Time analysis: a treemap displays the various business capabilities and the applications that cover them.
• Criteria Time Analysis: a table displays the values of the selected indicators according to the dates indicated.
Access
Parameters
Example

Business Capabilities Tree Map
This report displays capabilities as a treemap. Each capability is represented by a rectangle.
The size of each rectangle:
• is determined based on all the capabilities and sub-capabilities displayed on the treemap.
• varies according to one of the following three criteria:
• Number of components: The size of the capability is proportional to the number of sub-capabilities linked to it.
Intermediate capabilities (non-leaf nodes in the tree) are also taken into account.• Application ratio: the size is proportional to the number of applications that support the capability and its sub-capabilities.
• Application cost: The size is proportional to the total cost of the applications that support the capability and its sub-capabilities.
For more information on the use of a Treemap, see Handling a Treemap.Take note that:
• An application can support multiple capabilities. In this case, the "Cost Contribution Key" ratio is applied to the "Application ratio" and "Application cost" criteria.
The Cost Contribution Key represents the contribution percentage of an application to a business capability.The cost contribution key value is defined in the application's properties for each business capability it supports. See Defining the contribution of an application to a business capability.• An application that supports an intermediate capability is considered to support all its sub-capabilities, with its contribution distributed evenly among them.
Access
Example
