Handling a Heatmap
You can create heatmap charts through the use of two qualitative criteria.
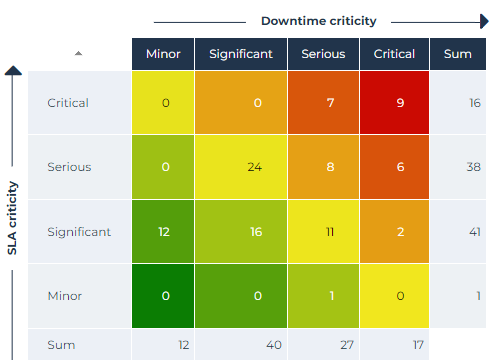
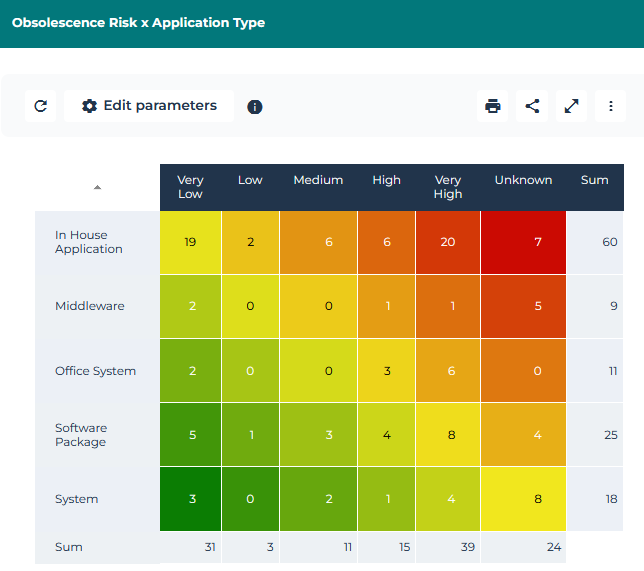
The following heatmap shows the risk of obsolescence (Very Low, Low, etc.) of a list of applications according to their type (Office System, System, etc.).
In a heatmap, you can:
• improve its readability
• modify the text orientation of the header
E.g.: Diagonal.
• display blank for zero value cells
• modify its display
• delete the “total” row at the bottom, or modify its value
E.g.: Maximum.
• delete the “total” column to the right, or modify its value
• add a border to the heatmap and modify its style
• reverse the display of the series
• reverse the row order
• add a title and a direction (arrow) to columns
• add a title and a direction (arrow) to rows
• sort a column content
• get the list of objects contained in a cell.
E.g.: you can add a title and a direction to columns, modify the header orientation, hide null values from cells.
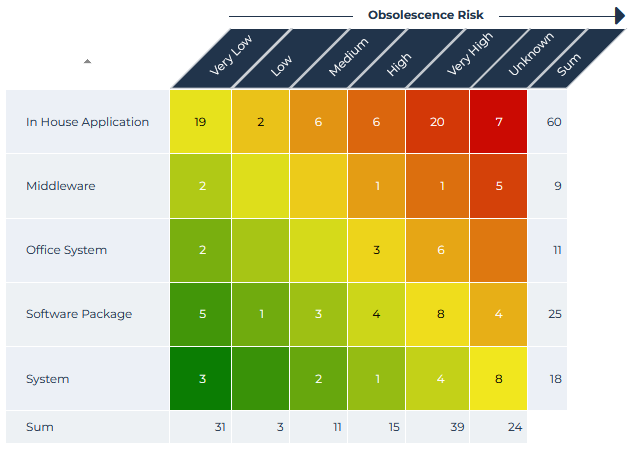
E.g.: you can invert the row order, add a title and a direction to rows and columns.