Handling a Chord Diagram
A chord diagram enables to quickly visualize the connections (dependencies or transfers) between objects:
• Each object is represented by a fragment of the outer part of the circle. The greater its dependency on the other concerned objects, the wider its fragment size.
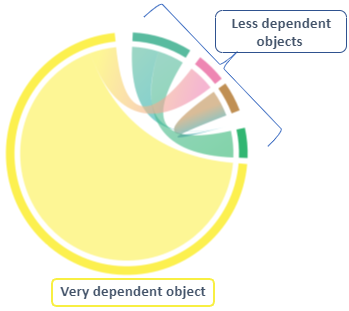
• A chord expresses relations between two objects.
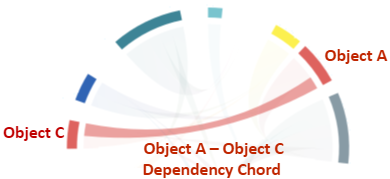
• The size of each chord end is proportional to the importance of its dependency. The wider is the chord end, the more the object concerned is dependent on the opposite object.
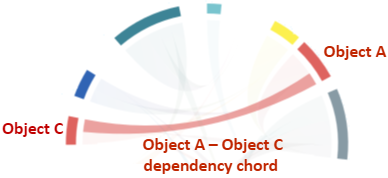
• Hovering over a chord, you can get the detail of dependencies between objects.
• If an object has components, you can navigate between its breakdown levels and display, for each level, the connections of its objects.
The chord diagram enables to focus on a chord to analyze the connections of its lower level.
You can:
• restrict the analysis to a single dependency type only (i.e. a chord).
By default all the dependencies are shown (those from the current level and those aggregated)
• navigate between levels: go one level down or up
• display the total dependencies of an object of the outer part of the circle (current node weight, opposite node weight)
• display the dependency weights of both chord ends
• get the detail of the elements held by a chord
Example of a Report Template showing a chord diagram
The “Agent Dependencies” report template highlights the dependencies between agents through the application flows exchanged between them or their components.
The chord diagram represents the volume of the flows received between applications. The more an application receives flows from other applications, the more it is dependent on these applications and wider is the chord end.
To handle a chord diagram:
1. Create a report based on the “Agent Dependencies” report template.
By default, all the connections are displayed.
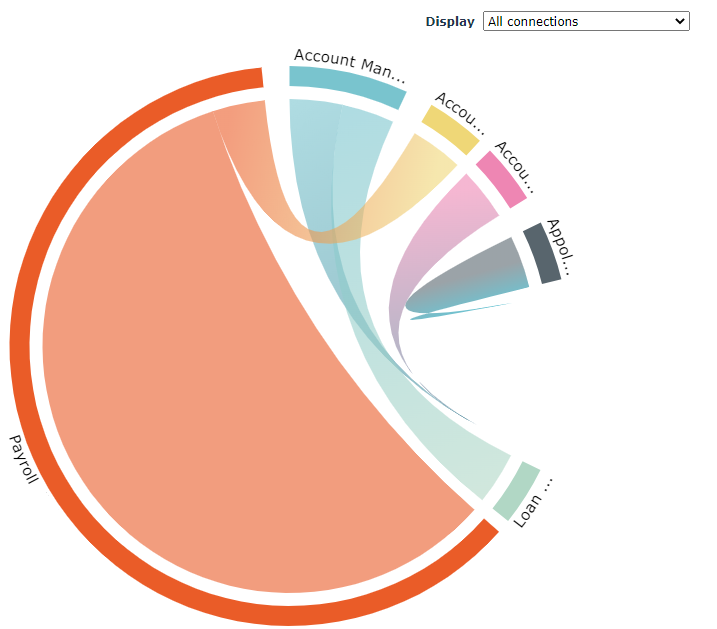
2. To restrict the connection display, in the Display field, select:
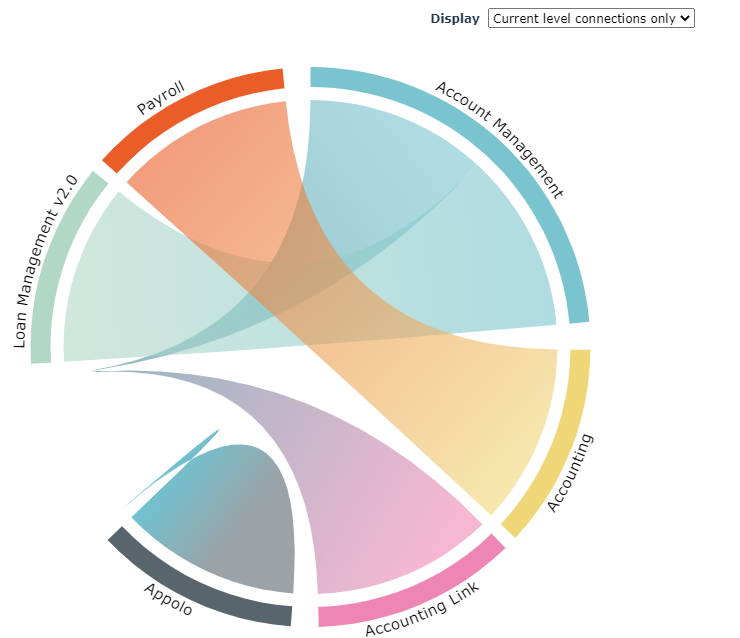
• current connections only (dependencies between applications)
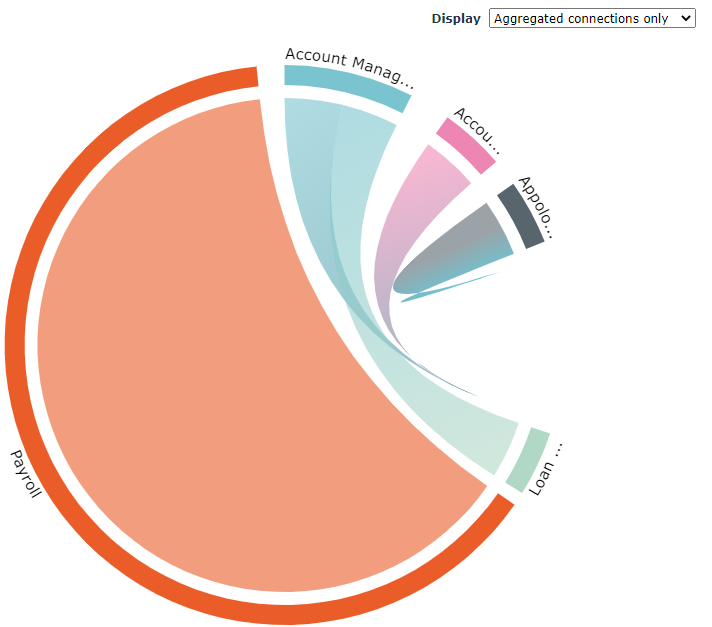
• aggregated connections only (dependencies between the components, application services)
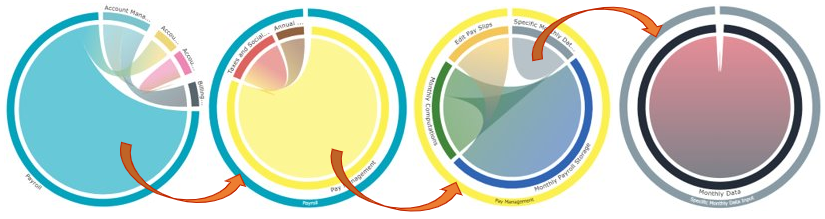
3. To display the connections of the first lower level, click the chord.
E.g.: click the “Payroll” application chord: the diagram displays the connections between the application services of the “Payroll” application.
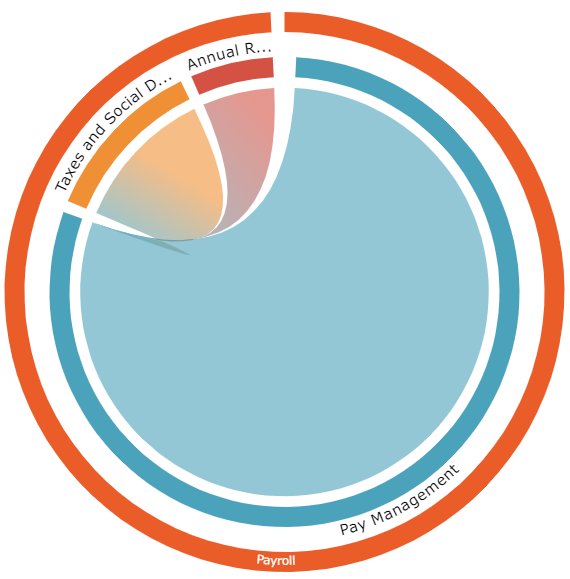
4. To display the connections of the next lower level, click a chord.
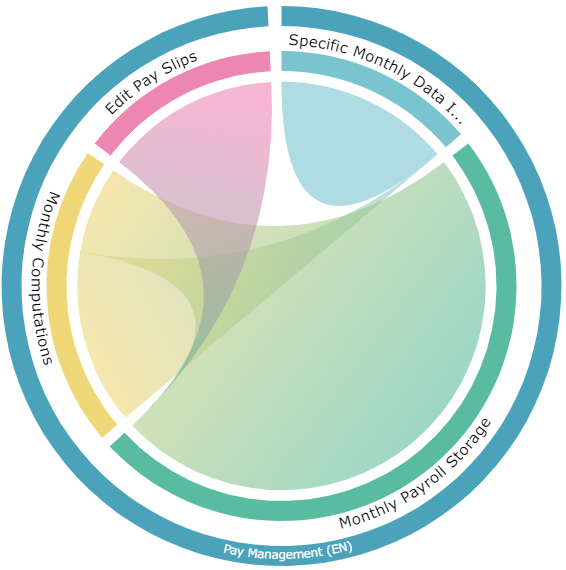
E.g.: click the “Pay Management” application service chord: the diagram displays the connections between the application services of the “Pay Management” application service.
5. Click a chord to go down one level, or click One level up  to go back to the upper level.
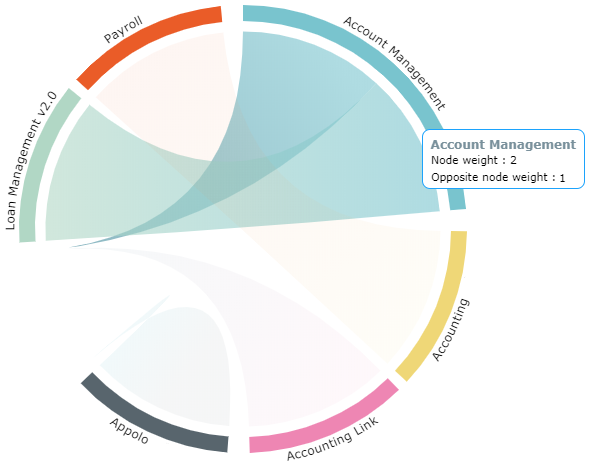
to go back to the upper level.6. Hover the mouse over an object of the outer part of the circle (fragment) to display its total dependencies on the other objects of the current level.
E.g.: the "Account Management” application weight is 2, the weight of its opposite nodes is 1 ("Loan Management V2" for 1 and "Loan Management" for 0).
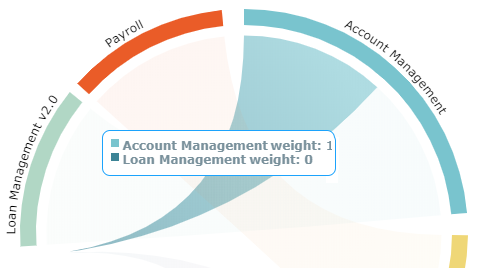
7. Hover the mouse over a chord to display the dependencies it represents between two nodes.
E.g.: the chord between "Account Management” (weight 1) and "Loan Management" (weight 0) applications.
8. Hover the mouse over a chord and click Click to view details  to get the list of the contents exchanged.
to get the list of the contents exchanged.E.g.: click Click to view details of "Monthly Payroll Storage" (weight 7).
of "Monthly Payroll Storage" (weight 7).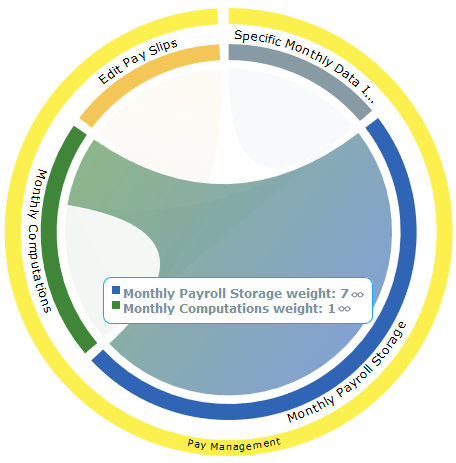
Contents display beneath the graphic.