Using Heatmap Questionnaires
A Heatmap enables to present the questionnaires sent in the form of a heatmap (and not in the form of questions in a list or table).
Use case
This type of questionnaire is used in HOPEX GRC to assess risks (direct multiple assessment and questionnaire campaigns).
When you open the questionnaire, two heatmaps are consecutively displayed:
• 1st heatmap: inherent risk calculation (Impact * Likelihood)
• 2nd heatmap: residual risk calculation (Inherent risk * Control Level)
Prerequisites to using heatmaps
Questionnaires in the form of heatmaps can be used in different contexts provided that:
• the questionnaire contains 3 questions, e.g.:
• Impact
• Likelihood
• Control Level
• 2 values are computed, e.g.:
• Inherent risk
• Residual risk
Examples of assessment via Interactive Heatmap
Let's take the example of risk assessment within the framework of HOPEX GRC.
To assess risks in their context via the interactive heatmap:
1. Open the questionnaire to complete from the e-mail you have received.
2. Open the questionnaire to complete.
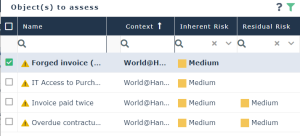
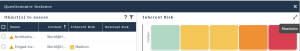
3. In the 1st heatmap, position the risks so as to specify:
• the Impact (in columns)
• the Likelihood (in rows)
The cell color corresponds to the value of the calculated Inherent Risk. The inherent risk is displayed in the corresponding column.
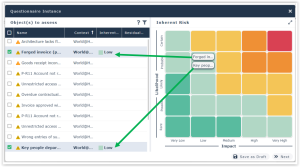
4. Make sure you have positioned all risks and click Next.
5. In the 2nd heatmap, drop the risks so as to specify the Control Level (in column).
You are allowed to drop the risks only onto the row which corresponds to the previously calculated inherent risk.
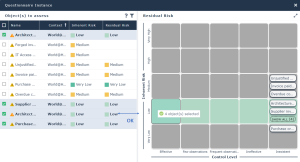
HOPEX does not allow you to position the risks in a non-authorized row.
6. Click Submit to submit answers.
Filtering risks
You may apply a filter to display only part of the assessed risks in the list.
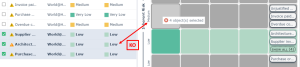
To display only the objects contained in a cell:
Only the risks contained in the cell appear in the list (4 risks in our example):
To delete the applied filter:
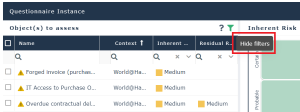
All the risks of the heatmap appear in the list.
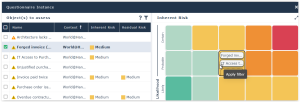
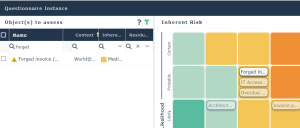
To filter the objects of the list by name:
1. Click the Apply filters icon and enter part of the name of the risk.
2. Risks corresponding to the search are displayed in the list.
Those that do not correspond to the search are semi-transparent in the heatmap.
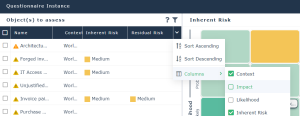
Using the heatmap columns to assess risks
You may choose to assess risks via the columns of the list (and not via the cells of the heatmap).
To assess risks from the list:
1. Display the Impact and Likelihood columns.
2. Fill in the column values for each risk in its context.
The inherent risk is calculated.
Displaying the heatmap in full screen
To display the heatmap in full screen:
Sorting risks
To sort risks in a list:
The order in the list impacts the order of risks in the cells.