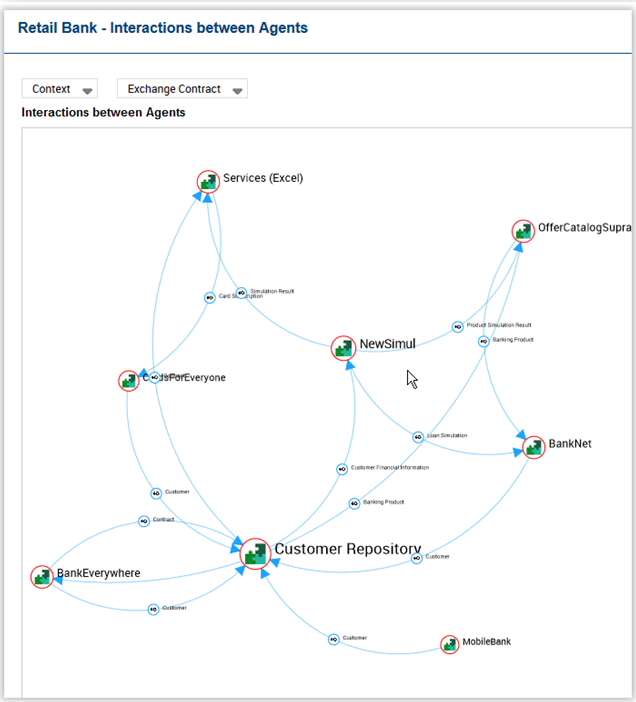
Graph of service interactions between Agents
This graph displays a synthesis of all service interactions between some agents (Application System, Application, IT Service, Microservice etc.) selected by user.
Filters can be applied on display by selecting some exchanged service interactions and/or service interaction contexts.
Report can be visualized in 2D or 3D.
Graph of service interactions between Agents example
Report parameters
This consists of defining report input data.
Parameters | Parameter type | Constraints |
|---|---|---|
Root object | Application System, Application, IT Service or Microservice. | One object mandatory. |