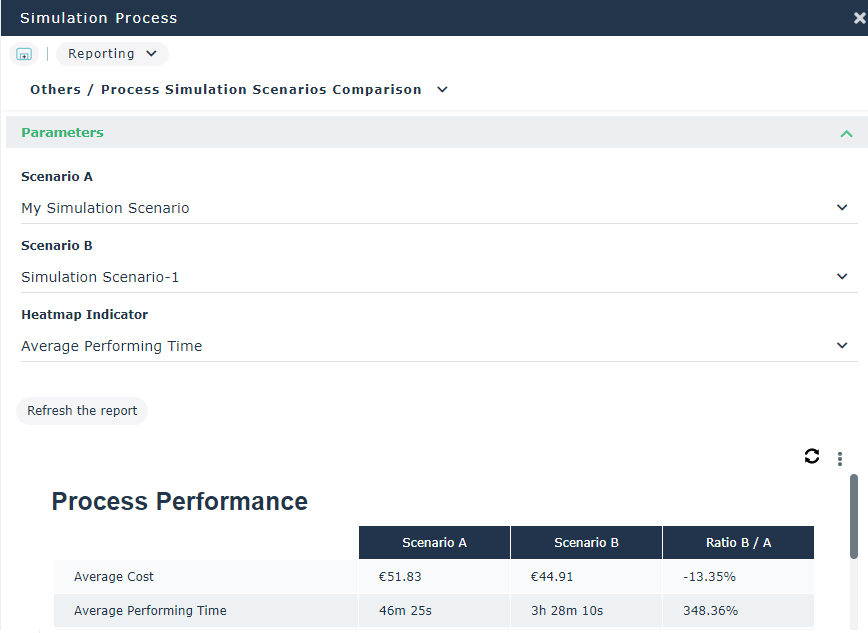
Scenario Comparison Report of a Process
From the Process Report property page, you can view the comparison report of two process simulation scenarios.
To access the process simulation scenario comparison report:
1. Open the Reporting property page of the process that interests you.
2. Select Others > Process Simulation Scenarios Comparison.
3. In the Parameters select the Scenario A and the Scenario B.
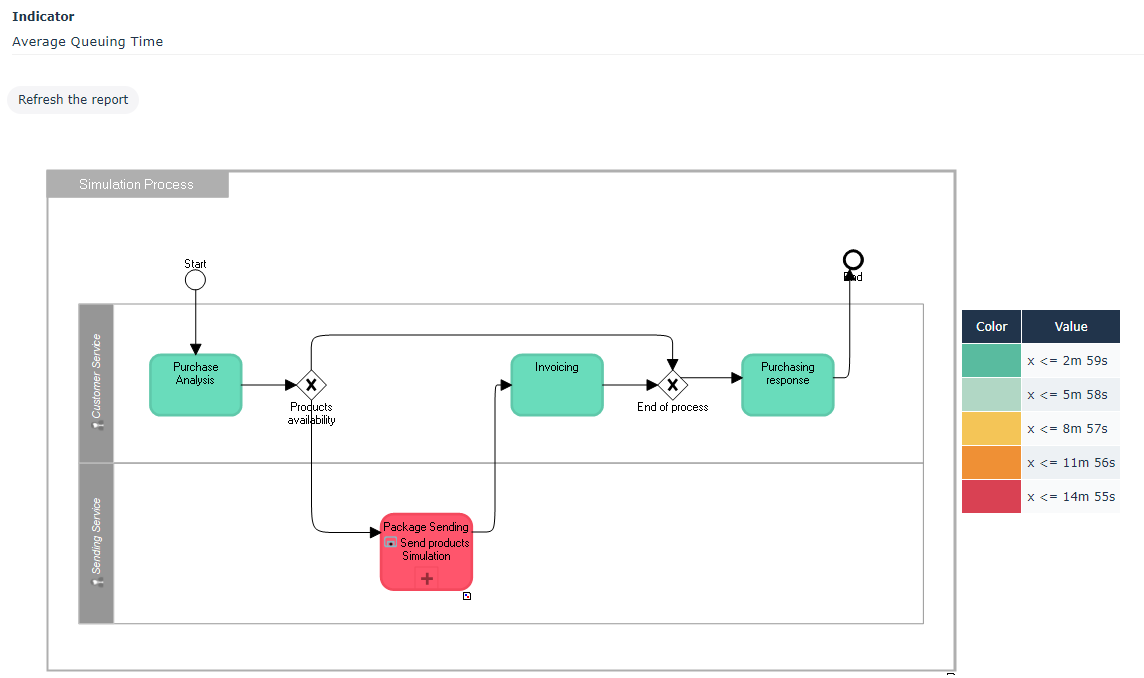
4. In the Heatmap Indicator field, select the indicator that will be used for the presentation of the Indicator Map.
Indicators proposed are:
• the average cost,
• the average performing time,
• the utilization.
5. Click the Refresh the report button.
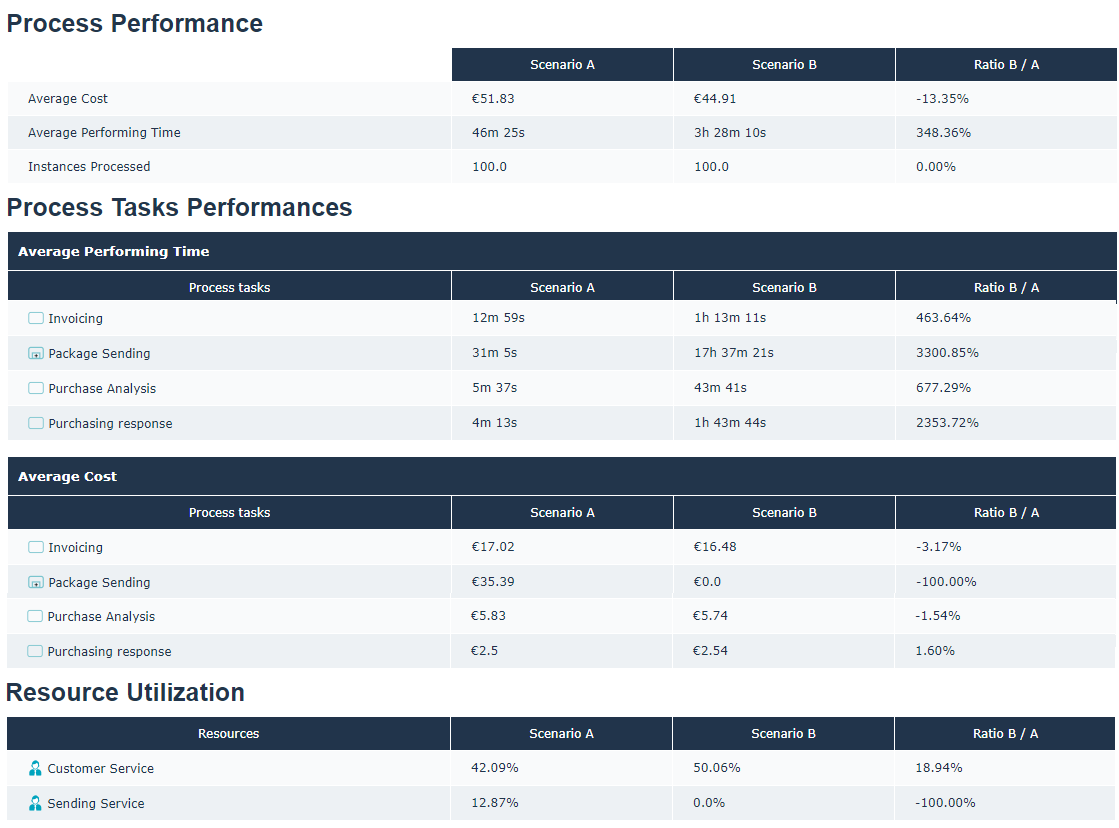
The graphs below allow a comparison of the performance of the different elements of the simulated process.