Cause-and-Effect Diagram
Analysis of the most important risks can be completed with the help of a cause-and-effect diagram to describe the sequence of its causes and/or its effects. This study could reveal new risks or risk factors.
A Cause-and-Effect diagram, also called a "Ishikawa Diagram" or a "Fishbone Diagram" enables description of a sequence of causes and effects for problem or issue analysis.
To create a cause-and-effect diagram:
1. In the list of risks, click the Create Diagram  icon related to the selected risk.
icon related to the selected risk.The diagram creation window opens.
2. Select Cause and Effect diagram.
The diagram creation window appears.
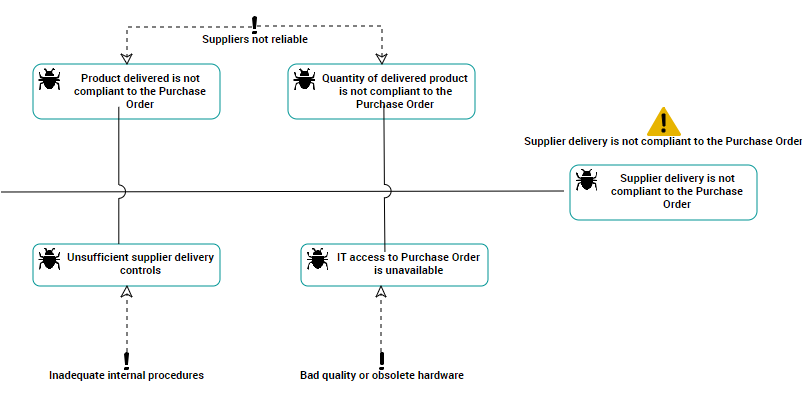
Cause-and-effect diagram
In the above example, we analyze possible causes of the "Supplier delivery non-conform to purchase order" risk.
We list possible causes of the problem, and for each cause we specify the corresponding risk factors. At this point it is possible to identify new risks.