Plan Synthesis
This report presents an overview of plan indicators.
Path
Plan property page> Reports > Overview
Result
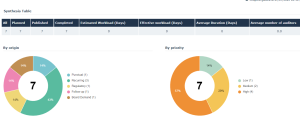
A summary table presents:
• number of tests (total number, number of tests planned, published and completed)
• estimated and effective workload (in days)
• average duration (days)
• average number of controllers
Charts present the distribution of tests by:
• origin
• priority
• category
• score
• status
Example