Previewing the TreeSet
From the TreeSet Definition properties you can test the TreeSet.
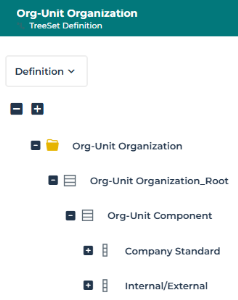
For example, you can test the Org-Unit Organization TreeSet Definition.
To preview the TreeSet:
1. Access the TreeSet Definition properties.
2. In its Preview page, click Create Preview.
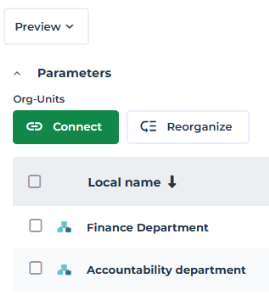
3. (If needed) In the Parameters section, define the parameters:
• (if collection parameter-based TreeSet Definition) in the <Collection Parameter GUIName> list/field, click Connect and connect the MetaClass items required.
Example: in the Org-Units list, which is the Collection Parameter GUIName, connect Org-Units.
• (if property parameters are used) enter the parameter values.
4. (To get more space for the report) In the Parameters section title, click  to collapse the section.
to collapse the section.5. Click Apply Parameters.
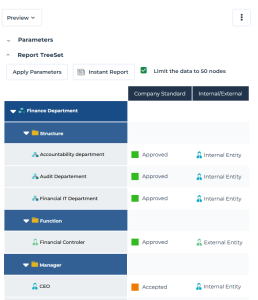
The TreeSet is displayed as a TreeTable renderer type.
Three levels of the tree are expanded by default.
The display is limited to 50 nodes by default (clear Limit the data to 50 nodes to display more data).
Ex.: this TreeSet is based on the "Finance Department" and "Accountability Department” Org-Units and displays for each Org-Unit child its Company Standard and Internal/External values.
Org-Unit children are grouped by type in the corresponding Org-Unit Type folder.
6. In the Report TreeSet section, click Instant Report to create instant report of the following types:
• Breakdown
• Dendrogram
• TreeTable
• TreeMap
Generating Instant Reports from a TreeSet
From the Preview page of the TreeSet Definition, you can generate instant reports of the following renderer types:
• Breakdown
• Dendrogram
• TreeTable
• TreeMap
Objects from a Data Reading access not accessible to the user are not displayed in the report.
The Instant report is generated with a Configuration pane, which enables to modify the report configuration.
Breakdown
With the Breakdown type report, properties (when defined) are not displayed.
To generate a breakdown type report:
1. Access the TreeSet Definition.
2. From its Preview page, click Instant Report and select Breakdown.
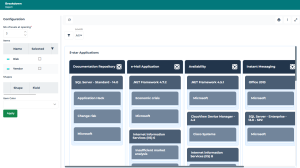
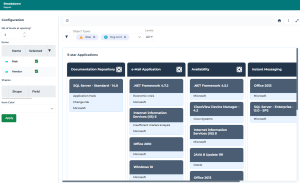
By default, at opening, the breakdown map displays:
• a maximum of three levels of Components
• no items
E.g.: this Breakdown map is based on five applications, which all have a ranking of 5 stars. For each of them, its Technologies are displayed.
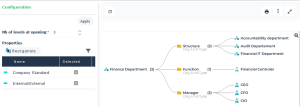
3. To configure the default display, in the Configuration pane, you can:
• modify the number of displayed levels at opening: in the Nb of levels at opening, select the required number.
• display items: select Selected check box for each corresponding item you want to display in the breakdown report.
E.g.: select "Risk" and "Vendor".
• Click Apply.
All selected items and corresponding filters are added to the report.
4. To handle the breakdown map display:
• In the Object Types field, use the drop-down arrow to select the items you want to hide/display.
• In the Levels field, select the required displayed level.
• Click Show Filters  and select the columns you want to display (by default all of them are displayed)
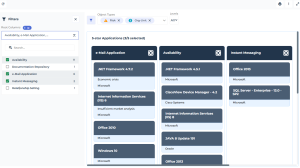
and select the columns you want to display (by default all of them are displayed)E.g.: select Availability, e-mail Application, and Instant Messaging.
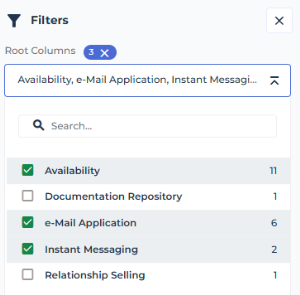
Other columns are automatically hidden.
E.g.: Documentation Repository and Relationship Sailing are hidden.
5. Save the Breakdown map to create a Report Template or a Tree View.
Dendrogram
With the Dendrogram type report, properties (when defined) are displayed on object in a pop-up window.
To create a Dendrogram type report:
1. Access the TreeSet Definition.
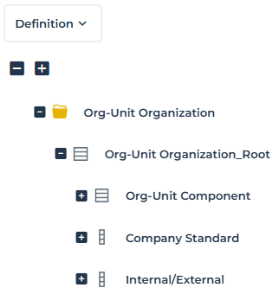
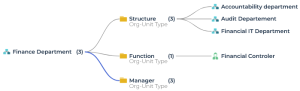
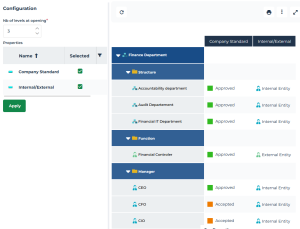
E.g.: this TreeSet Definition is based on an Org-Unit and displays for each Org-Unit child its Company Standard and Internal/External values.
2. From its Preview page, click Instant Report and select Dendrogram.
By default, the dendrogram displays three levels.
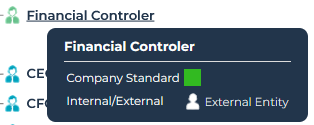
3. To view the Properties (if any): hover the cursor over a node.
Example: hover the cursor over "Financial Controler", its "Company Standard" and "Internal/External" values are displayed in a pop-up window.
4. In the Configuration section, you can modify the display:
• Modify the number of expanded levels at opening: in the Nb of levels at opening, select the required number.
• Reorganize the property order in the pop-up window: click Reorganize, and drag and drop the properties so as to get another display order, and click OK.
• Click Apply and Refresh  the report.
the report.5. To handle the dendrogram:
• Click a node to hide its daughter branches.
Example: click "Manager" component, its three daughter branches are hidden.
• Below the graph, click Options  to:
to:
to:- reduce/increase the space between the nodes
- reduce the label length
• Use the mouse wheel to zoom in (/out) the graphic.
6. Save the Dendrogram to create a Report Template or a Tree View.
TreeMap
With the TreeMap type report, properties (when defined) are displayed on object in a pop-up window.
To create a TreeMap type report:
1. Access the TreeSet Definition.

2. From its Preview page, click Instant Report and select TreeMap.
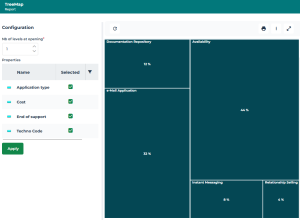
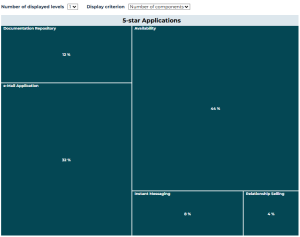
By default, the TreeMap displays only one level at opening.
E.g.: this TreeMap is based on five applications, which all have a ranking of 5 stars.
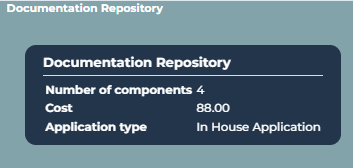
3. To view the Properties (if any): hover the cursor over a box.
Its properties are displayed in a pop-up window.
Example: hover the cursor over "Documentation Repository" Application, its "Cost" and "Application Type" values are displayed in a pop-up window.
4. To configure the default display, in the Configuration pane, you can modify:
• the number of levels displayed at opening: in the Nb of levels at opening, select the required number.
• the Properties displayed: clear the Selected check box corresponding to the property you do not want to display in the TreeMap.
• Click Apply.
Your modifications are directly taken into account.
5. To handle the TreeTable, above the TreeTable:
• modify the Number of displayed levels
• modify the Display criterion (when available)
For example, display the applications according to their "number of components".
- with 1 displayed level (so that Applications are displayed).
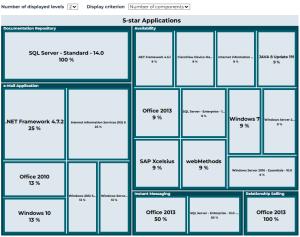
- with 2 displayed levels (so that their technologies are displayed).
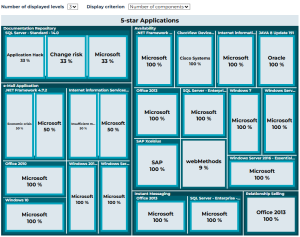
- with 3 displayed levels (so that the Vendors are displayed).
6. Save the TreeMap to create a Report Template or a Tree View.
TreeTable
With the TreeTable type report, properties (when defined) define the Column headers of the table.
To create a TreeTable type report:
1. Access the TreeSet Definition.
Ex. 1: this TreeSet Definition is based on an Org-Unit and displays for each Org-Unit child its Company Standard and Internal/External values.

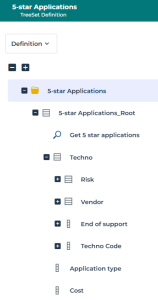
Ex. 2: this TreeSet Definition is based on the Applications that have a 5-star ranking, and displays for each of them its Technologies, and for each of its Technologies its Vendor and Risks.
It also displays Properties: "Application Type" and "Cost" values of each application, and "Techno Code" and "End of support" date of each technology.
2. From its Preview page, click Instant Report and select TreeTable.
By default, the TreeTable displays three levels.
It displays the objects in rows and the properties in columns.
E.g. 1: this TreeSet is based on the Finance Department Org-Unit.
3. To configure the default display, in the Configuration pane, you can modify:
• the number of levels displayed at opening: in the Nb of levels at opening, select the required number.
• the Properties displayed: clear the Selected check box corresponding to the property you do not want to display in the TreeTable.
• Click Apply.
Your modifications are directly taken into account.
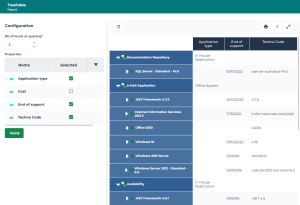
E.g. 2: this TreeSet is based on several applications, which all have a ranking of 5 stars. The Nb of displayed level at opening is set to 2 and the "Cost" property is hidden.
4. Save the TreeTable to create a Report Template or a Tree View.