Handling a Bar Chart or Line Chart
Zooming in on a chart part
For improved readability, you can zoom in on a chart part.
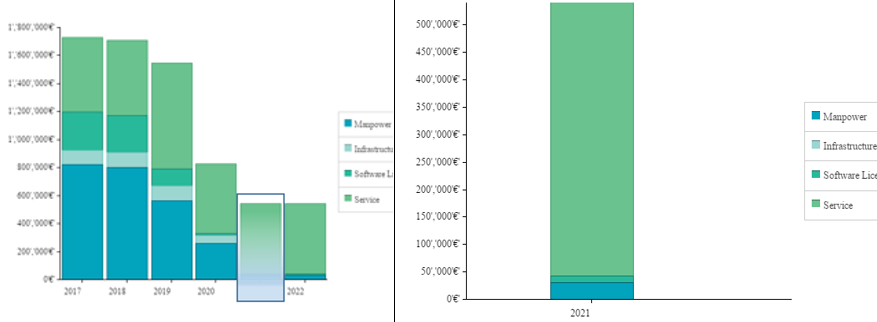
To zoom on one part of a chart:
1. Access the report concerned.
2. In the chart, with the mouse, click and draw a frame of the area you want to zoom in.
The selected part is automatically zoomed.
 or double-click in the chart.
Modifying the chart content
You may, for example:
• reverse the display of the series
• show/hide the values (values or percentage) in the bars.
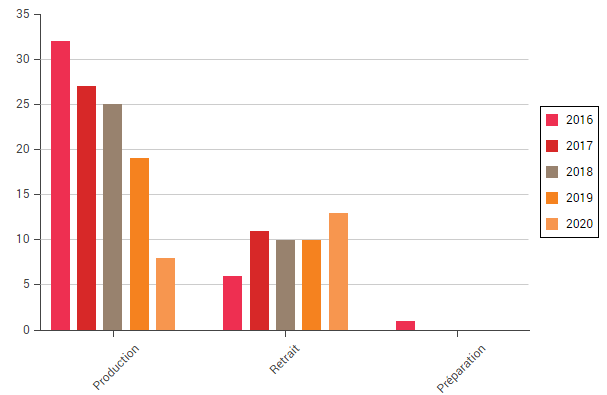
• add a title on the horizontal and/or vertical axis
Modifying the chart style
You may, for example:
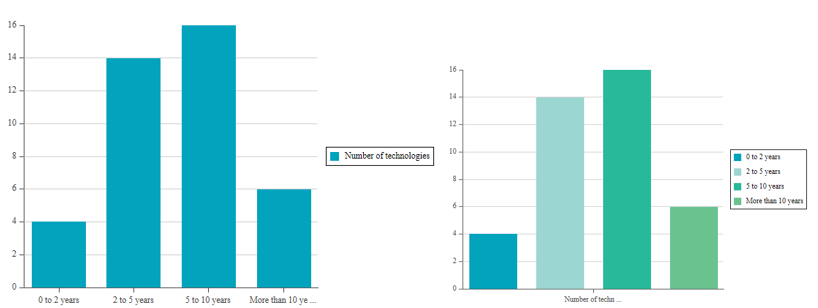
• modify the color palette of the series
• add a horizontal and/or vertical grid
• add a horizontal and/or vertical grid spacing
• stack the bars
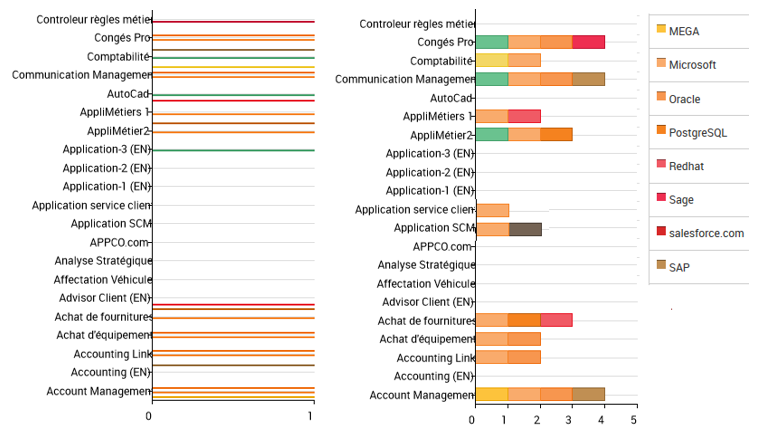
• stack the bars (percentage)
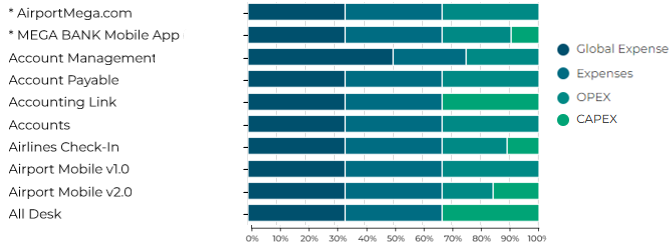
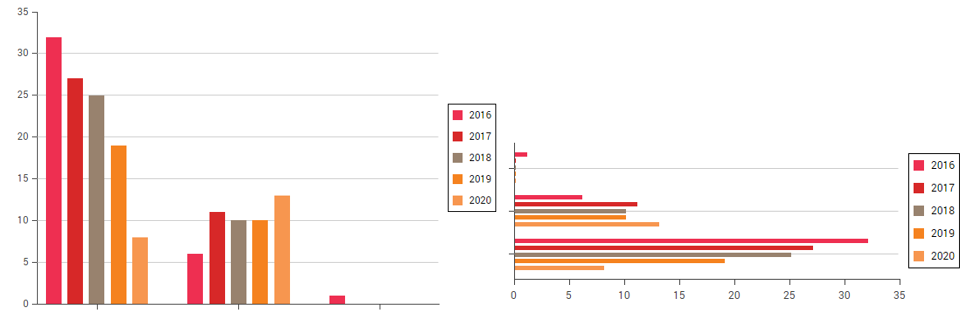
• reverse the bar direction (vertical or horizontal)
Modifying the label style
You may, for example:
• hide the axes
• define the maximum value of axes
• truncate the labels
• reverse the label order
• sort by value order (vertical axis)
• define a display angle for the horizontal label (in degrees)
Modifying the legend style
You may, for example:
• hide/show the legend
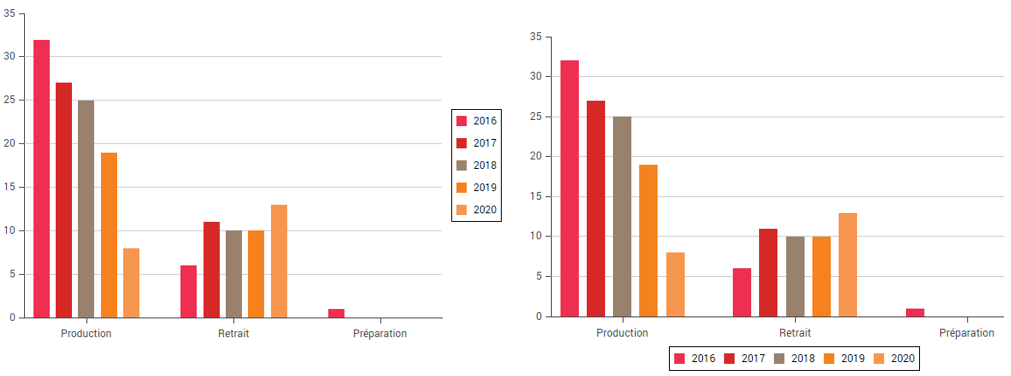
• modify the position of the legend (on the bottom or right)
• hide/show the legend frame
Modifying the parameter style of a series
You can:
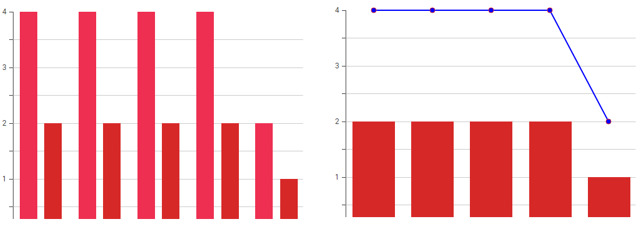
• modify the display style (as bars or as lines)
• modify the series color