Scenario Reports
You can view the scenario reports in the Reporting tab.
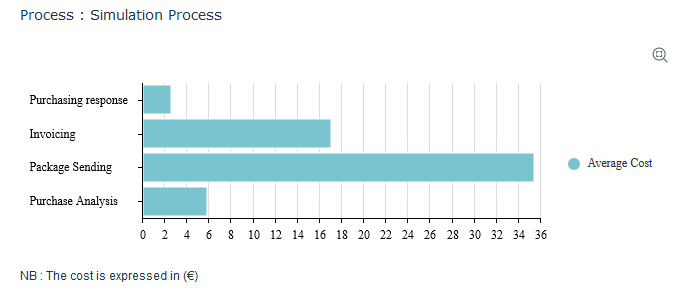
Scenario overall results
You can view the scenario report in the Reporting > Mining & Simulation > 1- Overall Results tab.
The graphs below allow a comparison of the performance of the different components of the simulated process.

Detailed results and heatmap
This report displays a heatmap of the simulated process components performances.
You can view the scenario report in the Reporting > Mining & Simulation > 2- Detailed Results and Heatmap tab.
The Indicator parameter is used to compare components on the following criteria:
• the average cost,
• the utilization,
• the average queuing time,
• the average performing time.
The first part of the report is a heatmap. The values represented by colors are based on the maximum value achieved by the criteria.

The second part of the report presents in the table an overall of performances.

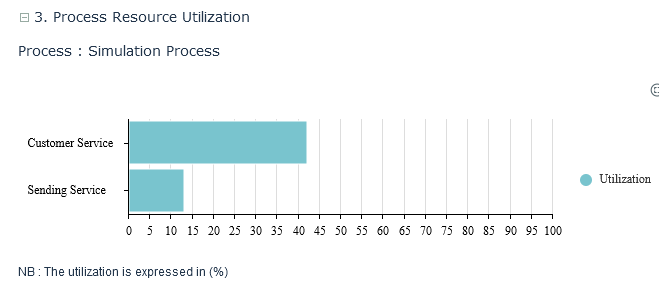
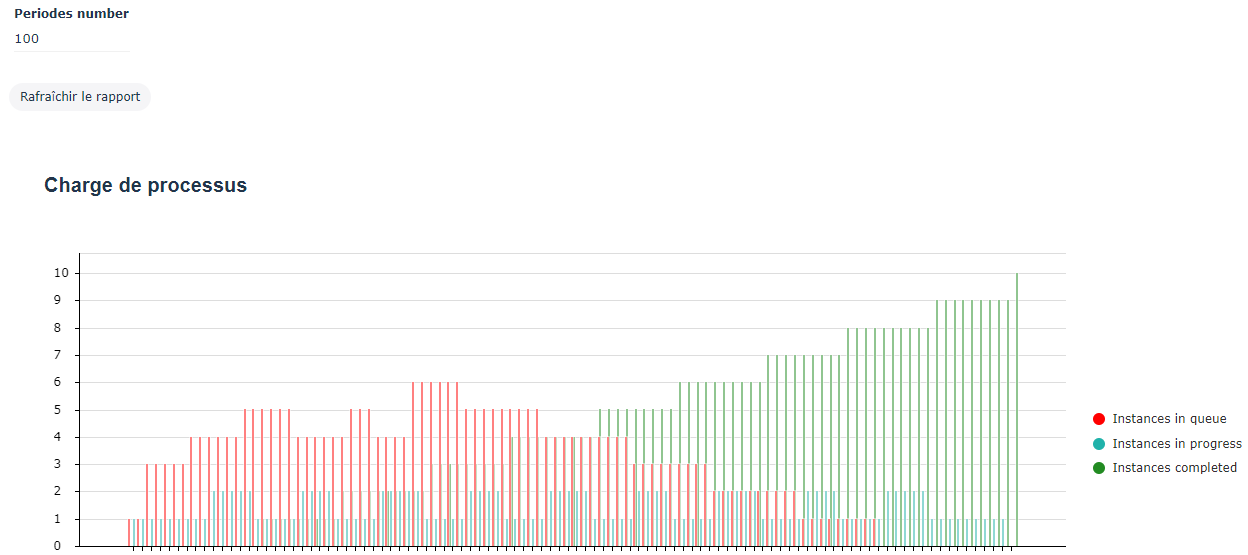
Process and Resource load
You can view the scenario report in the Reporting > Mining & Simulation > 3- Process and Resource Load tab.
The first part of this report presents the evolution of the mean number of instances in the process per period of time.
You can see:
• the evolution of the mean number of instances waiting in the process components per period of time.
• the evolution of the mean number of instances using resources in the process components per period of time.
• Total number of instances processed during the period.
Simulated process performances
The second part of the report presents the evolution of the periodic utilization of process resources. This graph helps to detect peak-loads that generate degraded performances.

Load of an Org-Unit