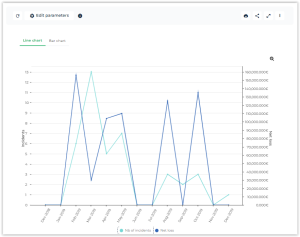
Incident and Loss Evolution by Month
This report displays monthly distribution of incidents and monthly distribution of losses on two different diagrams.
Access path
Navigation bar > Reports
Report parameters
This consists of selecting incidents and losses that will be presented by specifying elements that define their scope: risk types, entities, processes or business lines.
|
Parameters
|
Parameter type
|
Constraints
|
|---|---|---|
|
Currency
|
Currency
|
Currency of reports. Local currency is used by default.
|
|
Threshold
|
Real
|
Minimum amount of displayed losses.
|
|
Begin Date
|
Date
|
One year before current date by default.
|
|
End date
|
Date
|
Current date by default.
|
|
Risk Type
|
Risk Type
|
Selection of incidents connected to risk types of list or to their sub-risk types. Not mandatory.
|
|
Process
|
Process
|
Selection of incidents connected to processes of list or to their sub-processes. Not mandatory.
|
|
Process category
|
Process
category |
Selection of incidents connected to process categories of the list or to their sub-categories. Not mandatory.
|
|
Entities
|
Entity
|
Selection of incidents connected to entities of list or to their sub-entities. Not mandatory.
|
|
Business lines
|
Business lines
|
Selection of incidents connected to business lines of list or to their sub-business lines. Not mandatory.
|
Results
This report displays the number of incidents and the corresponding net loss (sum of losses - sum of recoveries) per month between two dates.