Action Plan Follow-up Report (Dashboard)
Parameters
|
Parameters
|
Constraint
|
|---|---|
|
Begin Date
|
|
|
End date
|
|
|
Entities
|
Optional
|
|
Processes
|
Optional
|
Result
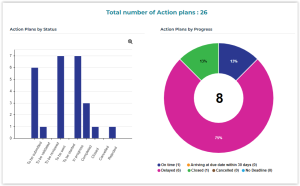
The number of action plans is displayed.
Several charts present the breakdown of action plans according to different criteria.
Action plans by status
This bar chart presents action plan statuses:
• To be submitted
• To be validated
• To review
• To be sent
• To be started
• Ongoing
• Completed
• Closed
• Canceled
Action plans by progress
This pie chart presents action plan breakdown according to their status. Possible statuses are the following:
• On Time
• in progress
• with due date exceeding 30 days
• Delayed:
• in progress
• with due date earlier than current date
• Approaching due date:
• in progress
• with due date between 0 and 30 days inclusive
• Canceled
• Closed
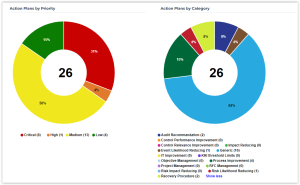
Action plan by priority
This pie chart presents action plan breakdown according to their priority.
Possible priorities are the following:
• Critical
• High
• Average
• Low
Action plans by category
This pie chart presents action plan breakdown according to their category.
Examples of possible action plan categories:
• Audit recommendation
• Impact-reducing
• Control relevance improvement
• ...
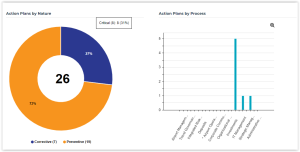
Action Plans by nature
• prevention
• corrective
Action plans by process
This bar chart presents breakdown of action plans for each process.
• x-axis: all processes (business and organizational)
• y-axis: number of action plans linked to each process and sub-process
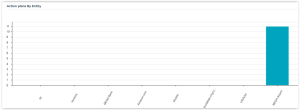
Action plans by entity
This bar chart presents breakdown of action plans for each entity.
• x-axis: all entities
• y-axis: number of action plans linked to each entity and sub-entity