Risk Control Level
Context
When a respondent completes a risk assessment questionnaire, HOPEX IRM displays a value for Control Level.
A value is displayed if:
• the risk is mitigated by one or several controls.
• controls mitigating the risk have already been assessed (and therefore shows a value for aggregated control level).
Computation method
The computation method consists of two steps:
1) Computation of control level average
Average Control Level = Total nb. of deficient controls * 25 / Total number of controls
2) Mapping the obtained result (rounded off to the next integer) with the Control Level internal values
Control level (On Risk) | Internal value |
|---|---|
Effective | 1 |
Few observations | 4 |
Frequent observations | 9 |
Ineffective | 16 |
Inexistent | 25 |
Example: Risk Control Level displays “Frequent observations” if control level average = 10.
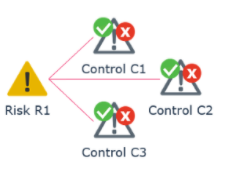
Computation example
Control | Aggregated Control Level | Control Level value |
|---|---|---|
C1 | 90% | 1 |
C2 | 45% | 0 |
C3 | 0% | 0 |
Control Level average = 2*25/3 = 16,6 -> rounded off to 17.
Risk Control Level is considered ineffective (because 16 is the internal value closest to 17).