Customizing Bold BI dashboards
The Bold BI Dashboard navigation pane is used to display the dashboards of your environment that have been customized using the Bold BI web application.
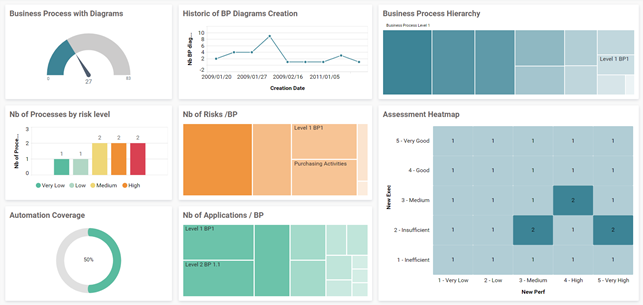
For example, the following dashboards are provided to illustrate this feature:
• Percentage of business processes described by a diagram;
• Historic of business processes diagrams creation;
• Number of business processes by risk level;
• Treemaps about:
• Number of risks per business process,
• Number of applications per business process,
• Business process hierarchy.
• Assessment heatmap.
Standard Bold BI dashboards provided with HOPEX Business Process Analysis
Summary of HOPEX Business Process Analysis options
Some options enable you to manage the access to different types of process.
To activate these options:
1. In the workspace, open the Options navigation window.
2. In the tree on the left, select HOPEX Solutions > Business Process Analysis.
3. Depending on features you want to do, you may select one of the following check boxes.
• Management of RACI in BPMN and Automatic synchronization of RACI by means of participants, see Process responsibilities,
• Risk Modeling MEGA 2009 /Risk Modeling HOPEX, see HOPEX Risk Mapper guide.
• Activate former BPMN data stores (HOPEX V3 and lower) / Activate BPMN data stores for conceptual, logical and physical layers (from HOPEX V3.1), see Using Data Stores.
• Activate the menu “Implementation Projects” (Hopex V3.2 and lower), this menu can be accessed from the Projects navigation pane.
•
•
•
•
•