Representation in a Diagram
You can represent risks and controls in a process diagram or an organizational chart.
To display risks in a process diagram with their likelihood:
1. Select Views and Details button.
2. In the right pane of the window, select “Risks and Controls” view.
Risks can be displayed in the diagram with colors that indicate their impact and likelihood.
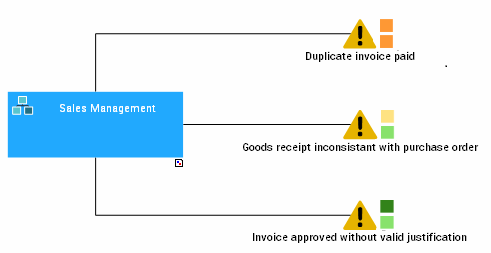
The colors vary according to the values resulting from the risk assessments.

Impact: medium, Likelihood: possible

Impact: very low, Likelihood: possible