Accessing the Process Events
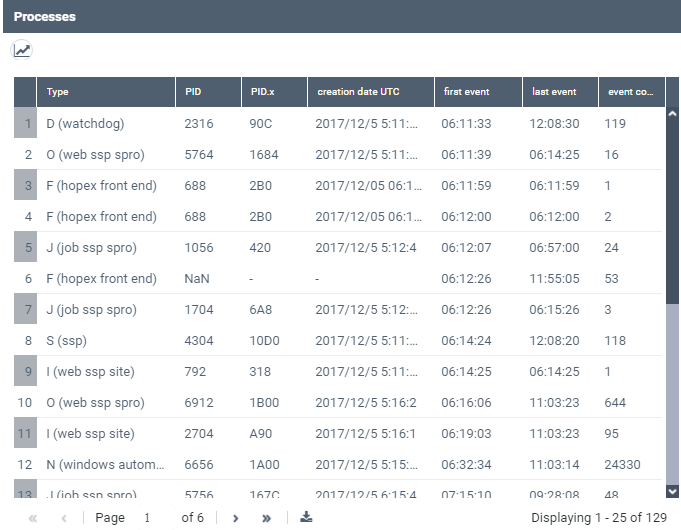
The Processes navigation pane gives access to all the supervised processes.
For each process it details:
• its Type
• its identifier PID (decimal format), PIDx (hexadecimal format)
• its Creation date (time in UTC format)
• its first event time and last event time (both in local time)
• its number of events (event count)
To access the process events:
1. Access the HOPEX Supervision console.
2. In the HOPEX Supervision console navigation panes, click Processes.
The Processes view is displayed.

3. Click:
• the process row you are interested in to get detailed information regarding all its events.
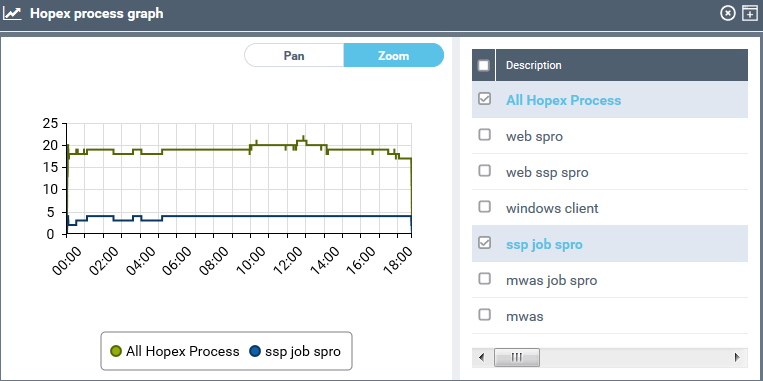
• Graph the number of supervised Hopex process  to display the graph of the supervised process number as a function of time.
 to display the graph of the supervised process number as a function of time.
In the Description pane, select the descriptors you want to be displayed in the graph, so as to see how many processes, and of which types, are loaded simultaneously.