Stacked Bar Chart of Initiatives
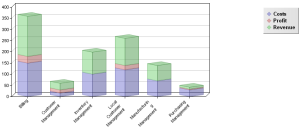
The stacked bar chart enables comparison of initiatives on several quantitative criteria. Values associated with each criterion for the different initiatives are stacked on the same bar.
The example below shows costs, benefits and revenues distribution for the different business applications.
Report parameters
This consists of defining report input data.
Parameter | Parameter object type | Constraints |
|---|---|---|
Report subject | Portfolio Initiative group Scenario | At least one subject mandatory. Initiatives are cumulated. |
List of criteria | Criterion | At least one criterion mandatory. |
Report options
This report template can be displayed with the following options:
• Form of bars
• Horizontal chart
• Bars in ascending order
• Order of configured bars
• 3D Depth
 For more details on specification of report options, see "Modifying report display options", page 320.