Report Data View properties
The following properties are common to both types of Report Content:
• Report Matrix View
• Report Table View
Characteristics
Report Matrix and Table Views show the same Characteristics page, including:
• Sharing:
• "Public" (default): the Report Data View can be reused in several reports. The Report Data view is available at Report Template or Report Chapter creation.
• "Private" : the Report Data View cannot be reused.
• Display, which defines the display associated with the Report Data View:
• "Table"
• "Graphic"
• "Graphic and table"
• Chart Type, which defines the graphic display type:
• "Area Chart"
• "Bar Chart"
• "Line Chart"
• "Radar Chart"
• "Set of gauges Chart" (for a Report Table View)
• "Pie Chart" (for a Report Table View)
Filter
Report Matrix and Table Views include the same Filter page, which enables to define which filters can be displayed in a report for this Report Data View.
A filter enables to restrict a Report DataSet column values, which are considered in the report. This Report DataSet column is not necessarily part of the report.
Characteristics
Each filter is defined by the following Characteristics:
• Visibility enables to hide the filter when it is fed by another filter or to display its value only.
• Object Edition Mode defines how objects are displayed and whether they are editable or not.
I.e.: Menu, In-Place Edit, No Edition.
• Input type defines how the report user can define its condition:
• "Single Value"
• "Multiple Values" when the column includes a restricted number of values.
• "Continuous" to define a range of values.
The condition is also column data type dependent.
• Behavior defines the filter action on the report:
• "Immediate Refresh" (for a report easily calculated): as soon as the user modifies the filter the report is updated.
• "No Refresh": the user needs to click the Refresh button to update the report.
• Filter Choice: defines what can be selected: one or several objects, or contains a value.
I.e.: "Single Choice", "Multiple Choice", "Contains".
• values:
• Initial Value: defines the default value on report opening.
• Contains: defines the values the user can use for a specific filter.
• Shows: defines how to manage empty values.
I.e.: "Add empty values", "Display only empty values", "Display only non empty values", or "Consider all values"
• for numerical values: Less than, Equals to, Greater than
• for character strings: Begins with, Ends with
Text
In Text, _Settings tab enables to define:
• an initial value
An initial value is the default value on report opening.
The user can modify the value.
paragraph [default Value]
• a candidate value
Candidate values are the values the user can use for a specific filter.
paragraph [Candidate]
The paragraph content depends on the filtered data type.
For a filter of type:
• Occurrence, the values are defined either by:
• an object defined a conventional variable:
Value = &Current
Example: Value=&CurrentUser
• an object list explicitly defined in field form:
Value = ~object1,~object2,…
• a set of occurrences obtained by applying a condition on the DataSource item occurrences
Value="Character string"
All of the occurrences, whose short name includes "character string".
• a set of occurrences retrieved by a query execution
Query = ~Query quoted : the values retrieved by the quoted query.
If the query does not include a parameter it is executed straight away, else the included parameter is valued by the report parameter quoted in the Parameter variable.
Parameter = ~Parameter
Defines the report parameter which enables to value the query parameter.
• Tabulated value attribute, the values are defined either by:
• a list of internal values explicitly quoted
Value=value1, value2, ...
Example: certain values of a multivalued attribute.
• a set of values obtained by applying a condition on the attribute internal values (numerical values)
ValueInferiorTo="Numerical value"
ValueSuperiorTo="Numerical value"
• Date, the values are defined either by:
• an object defined by a conventional variable
Value = &CurrentDate
• a list of dates explicitly quoted (Mega internal format for dates)
Value = 2016/15/25,...
• a set of dates obtained by applying a condition on the DataSource item occurrences
ValueInferiorTo="date" : all the dates < to the date.
ValueSuperiorTo="date" : all the dates > to the date.
• Numerical, the values are defined either by:
• a list of explicit values
Value=12,200,3000
• a set of values obtained by applying a condition on the DataSource item occurrences
ValueInferiorTo="Numerical value"
ValueSuperiorTo="Numerical value"
Style
All the Report Data View types include the same Style page, which enables to:
• define the style to apply to the Report Data View
• have a picture of the Report Data View items on which a conditional style is applied.
Chart
The Chart page is specific to Report Matrix and Table Views that include a chart for which the Chart Type is "Bar chart", "Line Chart", "Area chart", or "Radar chart". This page defines which element defines:
• the chart axes
• the chart legend
Matrix (Report Matrix View)
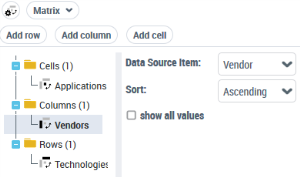
The Matrix page is specific to Report Matrix views. This page defines the matrix content, i.e. the data source columns on which is based the matrix:
• the Rows and Column folders:
Each item defines the content of all the rows and columns displayed in the matrix. The displayed data is provided by a Report Data Source Element.
• Data Source Item attribute defines the Report Data Source Element, which provides the data.
• Sort attribute defines which sorting is applied to the row/column.
• Show all values attribute defines if all the column possible values are displayed in the report. It is used only when rows or columns match a set a known values.
• the Cells folder:
Each item defines the content of all the cells displayed in the matrix. The displayed data is provided by a Report Data Source Element.
• Data Source Item attribute defines the Report Data Source Element, which provides the data.
• Report Cell Content attribute defines what is displayed in the cell.
I.e.: Value, Check mark, or details of objects.
• Value computation attribute defines which computation is applied to the set of values grouped in the cell. It operates only for cells with numerical values.
I.e.: Average, Count, Max, Median, Min, or Sum.
• Object Edition Mode attribute defines how objects are displayed and whether they are editable or not.
I.e.: Menu, In-Place Edit, No Edition.
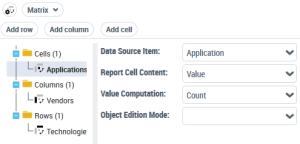
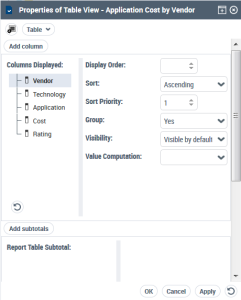
Table (Report Table View)
The Table page is specific to Report Table views. This page defines the table content:
• Columns Displayed defines the data source columns on which are based the table.
For each selected column item, the following parameters are defned:
• Display order: to define the column appearance order (if not specified, the row order is considered).
• Sort and Sort priority: to define the sorting direction and in which order it is applied.
• Group: to merge the pre-sorted set of cells showing the same value.
• Visibility: to define whether the column is visible by default or hidden by default, or never visible. When the column is visible by default or hidden by default the end-user can hide or display the column for his specific report using the report Edit mode.
• Value Computation: to define a computation when the tab includes a grouping.
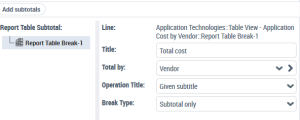
You can add subtotals to grouped rows (Group value is set to "yes"). Each added Report Table Subtotal defines the sub-total rows that have to be added to the table:
• Title: defines the name displayed in the added row.
• Total by: defines to which grouped rows the row is added.
• Operation Title: to add a subtitle, regarding the column, in the break. You can define the title ("Given subtitle") or keep the automatic title ("Automatic subtitle" which is defined from the computation function name). Default value is "No subtitle".
• Break type: defines where the row appears ("Subtotal only" or "Subtotal and Grand total")
On the row you can display several computation results performed on each column including numerical values.