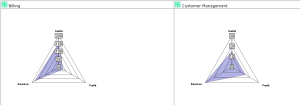
Radar Chart of Initiatives
A radar chart enables comparison of each initiative on criteria with different but comparable values. A radar chart is automatically created for each initiative of the portfolio or initiative group.
The axes of a radar chart are calculated on the basis of maximum value calculated on all the values of criteria represented.
The example below shows the position related to calculated costs, expected revenues and benefits. Note that the maximum value is revenue expected for all initiatives.
Report parameters
This consists of defining report input data.
Parameter | Parameter object type | Constraints |
|---|---|---|
Report subject | Portfolio Initiative group Scenario | At least one subject mandatory. One initiative per chart. |
List of criteria | Criterion | At least three criteria mandatory. |
Report options
This type of report can be displayed with the Stack all initiatives on a chart.