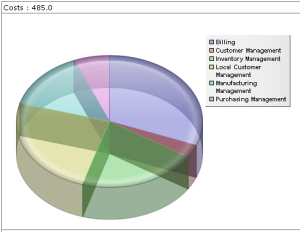
Pie Chart of Initiatives
The pie chart enables assessment of the contribution of each initiative on a particular criterion. Use this type of chart when all values are positive.
The example below shows cost distribution of the different applications.
Report parameters
This consists of defining report input data.
Parameter | Parameter object type | Constraints |
|---|---|---|
Report subject | Portfolio Initiative group Scenario | At least one subject mandatory. Initiatives are cumulated. |
List of criteria | Criterion | Mandatory One chart per criterion. |
Report options
This report template can be displayed with the following options:
• Display of percentages
• Detached sector
• 3D Depth