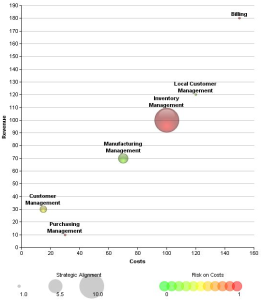
Bubble Chart of Initiatives
The bubble chart enables comparison of initiatives on a maximum of four different criteria. You must specify the criteria presented on the X-axis and the Y-axis and define bubble color and size.
The purpose of the example below is to compare cost aspects of different initiatives (X-axis), benefits (Y-axis), suitability to enterprise strategy (bubble size) and risks related to costs (bubble color).
Report options
This consists of defining report input data.
Parameter | Parameter object type | Constraints |
|---|---|---|
Report subject | Portfolio Initiative group Scenario | At least one subject mandatory. Initiatives are cumulated. |
X-axis | Criterion | Mandatory and unique. |
Y-axis | Criterion | Mandatory and unique. |
Color | Criterion | Optional, one maximum. |
Size | Criterion | Optional, one maximum. |