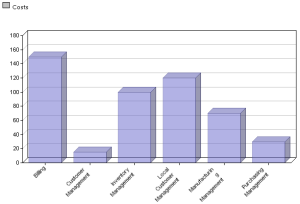
Bar Chart of Initiatives
The barchart enables comparison of initiatives based on a specific criterion.
The example below shows comparison of costs of different business applications.
Report parameters
This consists of defining report input data.
Parameter | Parameter object type | Constraints |
|---|---|---|
Report subject | Portfolio Initiative group Scenario | At least one subject mandatory. Initiatives are cumulated. |
List of criteria | Criterion | Mandatory One chart per criterion. |
Report options
This report template can be displayed with the following options:
• Form of bars
• Horizontal chart
• 3D Depth