Representation in a Diagram
To display risks in a diagram with their likelihood and impact:
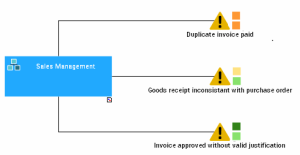
In the objects toolbar, the risk is represented by the "Danger" triangle  .
.
.The colors to the side of the "Danger" panel vary according to the values resulting from the risk assessments.

Impact: medium, Likelihood: possible

Impact: very low, Likelihood: possible
Risks can be displayed in the diagram with colors that indicate their impact and likelihood.