Compliance Widgets
Widgets are accessible from the dashboard via the home page.
They do not contain any parameters.
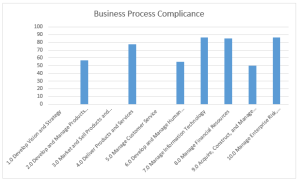
Process Compliance
This bar chart presents the control level for root processes.

Control level characterizes efficiency level of control elements deployed (controls) to assess the risk.
To access the applications of the process:

Click on the corresponding bar.
The list of process applications with their average compliance rate appears.
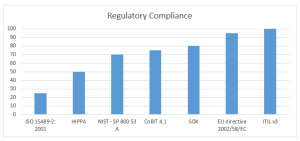
Regulatory compliance
This is a bar chart presenting:
• y-axis: the root regulation frameworks
A regulation or regulatory framework is a set of directives, compulsory or not, defined by a government in a law, by standard bodies as "best practices" or as an internal policy in an organization.
• x-axis: the average control level
Control level characterizes efficiency level of control elements deployed (controls) to assess the risk.
To access the requirements of the regulation framework:
Click on the corresponding bar.

Any existing sub-regulation frameworks are not displayed.
The list of requirements of the regulation framework with their compliance rate appears.
The compliance rate is the percentage of satisfactory controls per regulation framework.
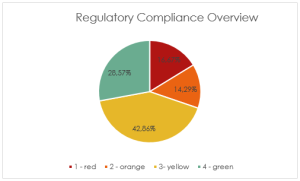
Global control level
This pie chart presents the breakdown of regulation frameworks by compliance level.
The compliance rate is the percentage of satisfactory controls per regulation framework.
A regulation or regulatory framework is a set of directives, compulsory or not, defined by a government in a law, by standard bodies as "best practices" or as an internal policy in an organization.
To display the list of regulation frameworks associated with a sector in the chart:
Click on the sector in question.