Representation in a Diagram
To display risks in a diagram with their likelihood and impact:

Select
View > Views and Details and select the "Risks" view.
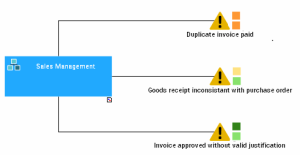
In the objects toolbar, the risk is represented by the "Danger" triangle

The colors to the side of the "Danger" panel vary according to the values resulting from the risk assessments.
Impact: medium, Likelihood: possible
Impact: very low, Likelihood: possible
Risks can be displayed in the diagram with colors that indicate their impact and likelihood.