Report Template with a Report Chapter Based on Report Data Views
For example, the "Application and Technolgies" Report Template is based on a single Report Chapter  named "Applications (Rating and Costs)" with:
• a Container Group  , which groups two containers on the same row, showing:
• a pie chart based on "application" and "Rating" elements of the "Application Technologies" Report DataSet
• a pie chart based on "Cost" and "Vendor" elements of the "Application Technologies" Report DataSet

• a Report Container  showing a table based on the "Application", "Cost", "Number of users", "Rating", "Technologies", and "Vendor" elements of the "Application Technologies" Report DataSet.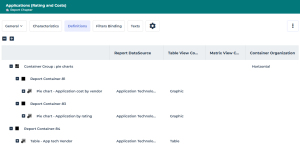
Each Report DataSet column  is an element that can be used in a Report DataView.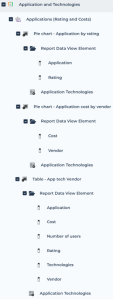
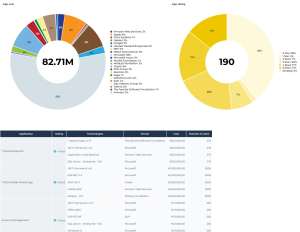
A report based on this "Application and technologies" Report Template shows the following two rows:
• the first row displays two pie charts showing:
• application cost by vendor
• applications by rating
• the second row shows a table with "Application", "Rating", "Technologies", "Vendors", "Cost", and "Number of users" columns.