Business Capabilities Reports
Reports enable you to analyze the business capabilities of your repository according to different perspectives.
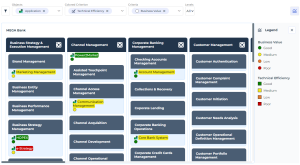
Business Capability Breakdown Report
You can use a breakdown report to visualize:
• the objects that make up a business capability map
• the realization of capabilities by EA equipment
Example
Access
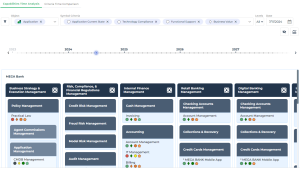
Business Capability Coverage over Time
This breakdown report provides a temporal representation of the elements that make up a business capability map and the applications or application systems that cover them.
Applications are analyzed according to various possible criteria. A timeline shows their evolution over several years.
Two views are available:
• Capabilities Time analysis: a treemap displays the various business capabilities and the applications that cover them.
• Criteria Time Analysis: a table displays the values of the selected indicators according to the dates indicated.
Example
Access
Parameters
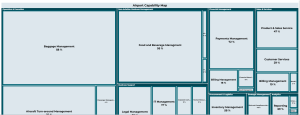
Business Capabilities Tree Map
This report breaks down a capability tree in the form of a treemap according to one of three possible criteria:
• Number of components: the surface area is proportional to the number of sub-capabilities in the tree.
• Application ratio: the surface area is proportional to the realization percentage of the current capability by applications.
• Cost of applications: the surface area is proportional to the cost of applications realizing current and descendant capabilities in the tree.
Take note that:
• Since an application can realize several capabilities, the "Cost Contribution Key" ratio is applied to the criteria "Application ratio" and "Cost of Applications".
• An application realizing an "intermediate" capability (i.e. not a leaf of the tree) is considered to realize all its sub-capabilities in a uniform way (strict pro rata between all sub-capabilities).
Example
Access