Process Map Breakdown
This report enables to represent in detail the breakdown of a process map. It also emphasizes process execution and performance indicators, and risk levels.
It is presented under the form of a breakdown report.
Path
Property pages of a process map > Reporting > Process Map Breakdown Report.
Report filters
|
Filter
|
Function
|
|---|---|
|
Levels
|
This enables to define the level of granularity for process breakdown (from a process category to an operation oar any finest level of detail).
|
|
Show
|
This enables to display risks and/or applications.
|
|
Performance
|
This enables to filter by process performance. For more details, see Assessing a process with HOPEX Business Process Analysis.
|
|
Execution
|
This enables to filter by process execution. For more details, see Assessing a process with HOPEX Business Process Analysis.
|
|
Inherent risk
|
This enables to filter by inherent risk level. For further details, see Assessing risks.
|
|
Residual risk
|
This enables to filter by residual risk level. For further details, see Assessing risks.
|
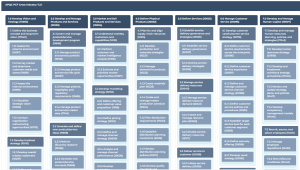
Result
The report displays the breakdown of a process map, with a certain level of detail according to the selected displayed levels.
It shows the connected objects (processes, applications, risks). KPIs are used to color code processes or as visual indicators.