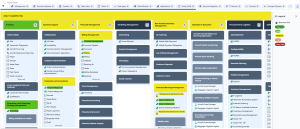
Risk Heatmap on Capabilities
This capability breakdown report uses color coding to represent:
• the names of capabilities (business or technology capabilities), or
• the names of the agents realizing those capabilities (applications or software technologies).
The color of the object name reflects the risk level associated with that object.
 For more details on use of a breakdown report, see Handling a Breakdown Report
Report objective
This report helps identify the business or technology capabilities that are most exposed to risk, enabling organizations to prioritize transformation initiatives and mitigation efforts.
It can be used by enterprise architects, capability and portfolio managers:
• during portfolio reviews
• when preparing a transformation roadmap
• to identify areas requiring action plans
Report parameters
|
Parameters
|
Parameter value
|
|---|---|
|
Capability map:
- hardware capability map
- business capability map
- technology capability map
- business skill map
- functionality map
|
1 capability map
|
|
Aggregation Type
|
- Worst case
- Average case
- Best case
|
The Aggregation Type parameter enables you to select the aggregation method used to determine the risk level of the realizing agent or the supported capability:
• Worst case: for each assessment node, retains the risk with the highest residual risk level.
• Average case: for each node, retains the average of the residual risk values.
• Best case: for each assessment node, retains the risk with the lowest residual risk level.

Report example