Introduction to the EA Dashboard
Accessing the EA dashboard
To access the EA dashboard:
 In the EA desktop navigation bar, click the Dashboard
  navigation menu.
The dashboard appears in the edit area.
 To display the EA dashboard in a new tab of the edit area, hover the mouse over the Dashboard navigation menu, then click Open in a new tab
  .
.Description of the EA dashboard
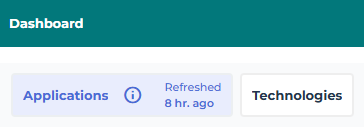
In the EA desktop, the Dashboard menu gives access to two dashboards dedicated to enterprise architecture:
• Applications
This dashboard provides a complete view of the application landscape to help you track application status, understand dependencies, and make informed decisions.
• Technologies
This dashboard provides an overall view of technologies used across the organization to help you track technology status, assess technology health and technical debt, and identify risks related to obsolescence and support limitations.
Each dashboard includes:
• a Reference Date (the current date by default)
• filters to refine the analysis of specific applications and technologies
• indicators showing the number of objects included in the analysis based on the applied filters
• widgets displaying data analysis charts according to the reference date and the applied filters
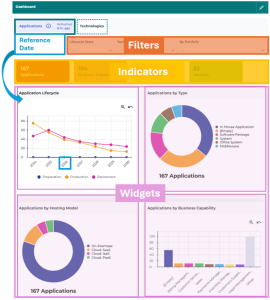
The charts are automatically updated as soon as a filter is applied.
Refresh date
By default, the dashboards are generated daily at 01:00 UTC.
If needed, the Hopex administrator can:
If needed, the Hopex administrator can:
• modify the dashboard generation schedule using the "Dashboard Generator Trigger" trigger (Scheduling > Scheduling > Predefined Triggers)
• regenerate the dashboards (Scheduling > Jobs) by running the Generate Dashboards job.
 See Managing Triggers.
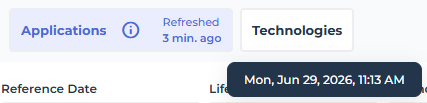
To find out the exact date on which the dashboards were generated:
Hover over Refreshed <x> hr. ago of the page concerned.Its tooltip shows the date and time the dashboards were last generated.
Reference Date and Filters

Reference date
By default the Reference Date is the current date.
• It defines the application and technology analysis date.
• For time-based charts, the analysis period spans six years relative to this date: two years before and four years after.
You can modify the Reference Date used for the application or technology analysis.
This date enables you to adjust the data analysis period.
 The time axis markers correspond to the first day of each year. After zooming in, they correspond to the first day of each quarter.
Filters
You can refine the application or technology analysis using the filters available on each dashboard:
• Lifecycle State
This filter enables you to restrict the analysis to applications/technologies that are in a specific state on the reference date.
Values: Preparation, Production, Retirement
• Technology Support
This filter enables you to restrict the analysis to applications whose associated technologies have a specific vendor support status on the reference date.
Values: General support, extended Support, No longer supported
• By Portfolio
Enables to restrict the analysis to applications/technologies belonging to a specific portfolio.
Indicators
Each dashboard displays indicators that are automatically updated based on the applied filters.
Applications
The dashboard of the Applications page displays the following indicators:
• Applications: number of applications analyzed based on the applied filters
E.g.: when the By Portfolio filter is used, only applications belonging to that portfolio are taken into account.
• Business Capabilities: number of business capabilities supported by the analyzed applications.
• Used Technologies: number of technologies used by the analyzed applications
• Vendors: number of vendors associated with the technologies used by the analyzed applications

Technologies
The dashboard of the Applications page displays the following indicators:
• Using Applications: number of applications that use the analyzed technologies
E.g.: when the Technology Support filter is used, only technologies whose vendor support status matches the selected value are analyzed.
• Business Capabilities: number of business capabilities supported by the analyzed applications.
• Technologies: number of technologies analyzed based on the applied filters
• Vendors: number of vendors associated with the analyzed technologies
